Water footprint of nations
Global view of national per capita water footprints
The water footprint of a nation is the amount of water used to produce the goods and services consumed by the inhabitants of that nation. Analysis of the water footprint of nations illustrates the global dimension of water consumption and pollution, by showing that several countries rely heavily on foreign water resources and that (consumption patterns in) many countries significantly and in various ways impact how, and how much, water is being consumed and polluted elsewhere on Earth. International water dependencies are substantial and are likely to increase with continued global trade liberalisation. The largest share (76%) of the virtual water flows between countries is related to international trade in crops and derived crop products. Trade in animal products and industrial products contributed 12% each to the global virtual water flows. The four major direct factors determining the water footprint of a country are: volume of consumption (related to the gross national income); consumption pattern (e.g. high versus low meat consumption); climate (growth conditions); and agricultural practice (water use efficiency).
Production or consumption
The assessment of total water use in connection to consumption can be approached from both ends of the supply chain.[32] The water footprint of production estimates how much water from local sources is used or polluted in order to provide the goods and services produced in that country. The water footprint of consumption of a country looks at the amount of water used or polluted (locally, or in the case of imported goods, in other countries) in connection with all the goods and services that are consumed by the inhabitants of that country. The water footprint of production and that of consumption, can also be estimated for any administrative unit such as a city, province, river basin or the entire world.[1]
Absolute or per capita
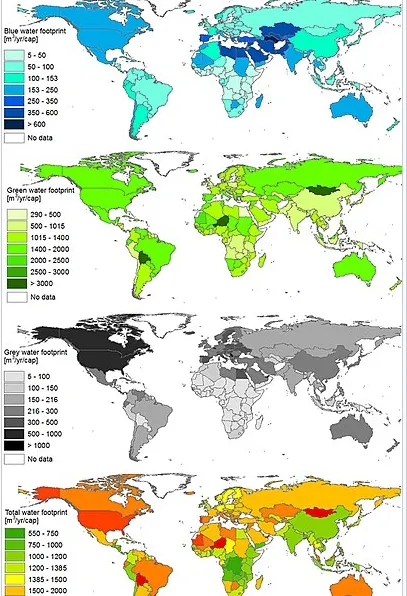
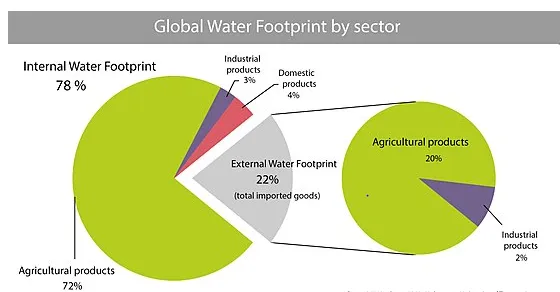
The absolute water footprint is the total sum of water footprints of all people. A country's per capita water footprint (that nation's water footprint divided by its number of inhabitants) can be used to compare its water footprint with those of other nations. The global water footprint in the period 1996–2005 was 9.087 Gm3/yr (Billion Cubic Metres per year, or 9.087.000.000.000.000 liters/year), of which 74% was and green, 11% blue, 15% grey. This is an average amount per capita of 1.385 Gm3/yr., or 3.800 liters per person per day. On average 92% of this is embedded in agricultural products consumed, 4.4% in industrial products consumed, and 3.6% is domestic water use. The global water footprint related to producing goods for export is 1.762 Gm3∕y.
In absolute terms, India is the country with the largest water footprint in the world, a total of 987 Gm3/yr. In relative terms (i.e. taking population size into account), the people of the USA have the largest water footprint, with 2480 m3/yr per capita, followed by the people in south European countries such as Greece, Italy and Spain (2300–2400 m3/yr per capita). High water footprints can also be found in Malaysia and Thailand. In contrast, the Chinese people have a relatively low per capita water footprint with an average of 700 m3/yr. (These numbers are also from the period 1996-2005)
Internal or external
Global average numbers and composition of all national water footprints, internal and external
The internal water footprint is the amount of water used from domestic water resources; the external water footprint is the amount of water used in other countries to produce goods and services imported and consumed by the inhabitants of the country. When assessing the water footprint of a nation, it is crucial to take into account the international flows of virtual water (also called embodied water, i.e. the water used or polluted in connection to all agricultural and industrial commodities) leaving and entering the country. When taking the use of domestic water resources as a starting point for calculating a nation’s water footprint, one should subtract the virtual water flows that leave the country and add the virtual water flows that enter the country.
The external part of a nation's water footprint varies strongly from country to country. Some African nations, such as Sudan, Mali, Nigeria, Ethiopia, Malawi and Chad have hardly any external water footprint, simply because they have little import. Some European countries on the other hand, e.g. Italy, Germany, the UK and the Netherlands have external water footprints that constitute 50–80% of their total water footprint. The agricultural products that on average contribute most to the external water footprints of nations are: bovine meat, soybean, wheat, cocoa, rice, cotton and maize.