Modeling Water Resource Systems
As will be discussed in greater detail in the following chapters of this book, there are many types of models and modeling approaches that have been developed and used to identify, study, and evaluate alternative water resource designs, management plans, and operating policies. But before outlining these model types and modeling approaches and how they can be used to best meet the needs of planners and managers, it may be useful to describe a specific modeling example based on Borsuk et al. (2001). In this example, a sequence of models are used to assess how effective reductions in upstream nutrient runoff may be in improving the habitat for fish and shellfish in a downstream estuary.
This example is followed by a discussion of the conditions needed that motivate the use of models, whether solely mental (Fig. 2.1) or both mental and mathematical (Fig. 2.2).
An Example Modeling Approach
Consider for example the sequence or chain of models illustrated in Fig. 2.3 required for the prediction of fish and shellfish survival as a function of nutrient loadings into an estuary. The condition of the fish and shellfish are important to the economy of the region and the income of many stakeholders. One way to maintain healthy stocks is to maintain sufficient levels of oxygen in the estuary. The way to do this is to control algae blooms. This in turn requires limiting the nutrient loadings to the estuary that can cause algae blooms and subsequent dissolved oxygen deficits. The modeling challenge is to link nutrient loading to fish and shellfish survival. In other words, can some quantitative relationship be defined relating the amount of nutrient loading to the amount of fish and shellfish survival?
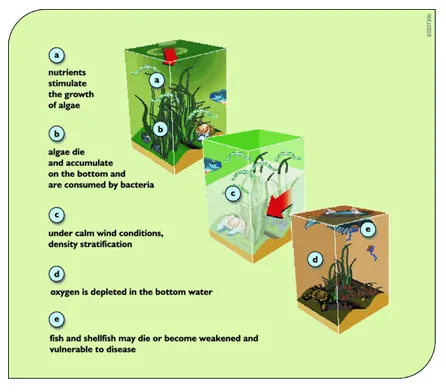
The impacts of excessive nutrients in an estuary
The negative effects of excessive nutrients (e.g., nitrogen) in an estuary are shown in Fig. 2.3. Nutrients stimulate the growth of algae. Algae die and accumulate on the bottom where bacteria consume them. Under calm wind conditions density stratification occurs. Oxygen is depleted in the bottom water. As a consequence, fish and shellfish may die or become weakened and more vulnerable to disease. A sequence of models, each providing input data to the next model, can be defined to predict shellfish and fish abundance in the estuary based on upstream nutrient loadings. These models, for each link shown in Fig. 2.4, can be a mix of judgmental, mechanistic, and/or statistical ones. Statistical models could range from simple regressions to complex artificial neural networks. Any type of model selected will have its advantages and its limitations. Its appropriateness may largely depend on the amount and precision of the data available for model calibration and verification.
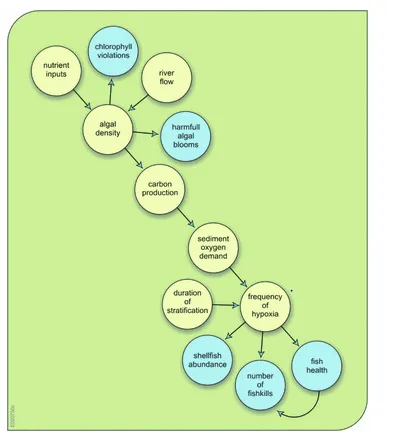
Fig. 2.4 Cause and effect diagram for estuary eutrophication due to excessive nutrient loadings
The results of any modeling exercise should be expressed in terms meaningful and of interest to those that will be making decisions taking into account those results. In this example ‘shell-fish abundance’ and ‘number of fish-kills’ are meaningful indicators to stakeholders and can be related to designated water body use.