Kullback Leibler Divergence, or KL Divergence for short, is a measure of how one probability distribution differs from a baseline distribution.
A KL divergence loss of 0 suggests the distributions are identical. In practice, the behavior of KL Divergence is very similar to cross-entropy. It calculates how much information is lost (in terms of bits) if the predicted probability distribution is used to approximate the desired target probability distribution.
As such, the KL divergence loss function is more commonly used when using models that learn to approximate a more complex function than simply multi-class classification, such as in the case of an autoencoder used for learning a dense feature representation under a model that must reconstruct the original input. In this case, KL divergence loss would be preferred. Nevertheless, it can be used for multi-class classification, in which case it is functionally equivalent to multi-class cross-entropy.
KL divergence loss can be used in Keras by specifying ‘kullback_leibler_divergence‘ in the compile() function.
1 | model.compile(loss='kullback_leibler_divergence', optimizer=opt, metrics=['accuracy']) |
As with cross-entropy, the output layer is configured with an n nodes (one for each class), in this case three nodes, and a ‘softmax‘ activation in order to predict the probability for each class.
Also, as with categorical cross-entropy, we must one hot encode the target variable to have an expected probability of 1.0 for the class value and 0.0 for all other class values.

1 2 | # one hot encode output variable y = to_categorical(y) |
The complete example of training an MLP with KL divergence loss for the blobs multi-class classification problem is listed below.

1 2 3 4 5 6 7 8 9 10 11 12 13 14 15 16 17 18 19 20 21 22 23 24 25 26 27 28 29 30 31 32 33 34 35 36 37 38 39 40 41 | # mlp for the blobs multi-class classification problem with kl divergence loss from sklearn.datasets.samples_generator import make_blobs from keras.layers import Dense from keras.models import Sequential from keras.optimizers import SGD from keras.utils import to_categorical from matplotlib import pyplot # generate 2d classification dataset X, y = make_blobs(n_samples=1000, centers=3, n_features=2, cluster_std=2, random_state=2) # one hot encode output variable y = to_categorical(y) # split into train and test n_train = 500 trainX, testX = X[:n_train, :], X[n_train:, :] trainy, testy = y[:n_train], y[n_train:] # define model model = Sequential() model.add(Dense(50, input_dim=2, activation='relu', kernel_initializer='he_uniform')) model.add(Dense(3, activation='softmax')) # compile model opt = SGD(lr=0.01, momentum=0.9) model.compile(loss='kullback_leibler_divergence', optimizer=opt, metrics=['accuracy']) # fit model history = model.fit(trainX, trainy, validation_data=(testX, testy), epochs=100, verbose=0) # evaluate the model _, train_acc = model.evaluate(trainX, trainy, verbose=0) _, test_acc = model.evaluate(testX, testy, verbose=0) print('Train: %.3f, Test: %.3f' % (train_acc, test_acc)) # plot loss during training pyplot.subplot(211) pyplot.title('Loss') pyplot.plot(history.history['loss'], label='train') pyplot.plot(history.history['val_loss'], label='test') pyplot.legend() # plot accuracy during training pyplot.subplot(212) pyplot.title('Accuracy') pyplot.plot(history.history['acc'], label='train') pyplot.plot(history.history['val_acc'], label='test') pyplot.legend() pyplot.show() |
Running the example first prints the classification accuracy for the model on the train and test dataset.
Given the stochastic nature of the training algorithm, your specific results may vary. Try running the example a few times.
In this case, we see performance that is similar to those results seen with cross-entropy loss, in this case about 82% accuracy on the train and test dataset.

1 | Train: 0.822, Test: 0.822 |
A figure is also created showing two line plots, the top with the KL divergence loss over epochs for the train (blue) and test (orange) dataset, and the bottom plot showing classification accuracy over epochs.
In this case, the plot shows good convergence behavior for both loss and classification accuracy. It is very likely that an evaluation of cross-entropy would result in nearly identical behavior given the similarities in the measure.
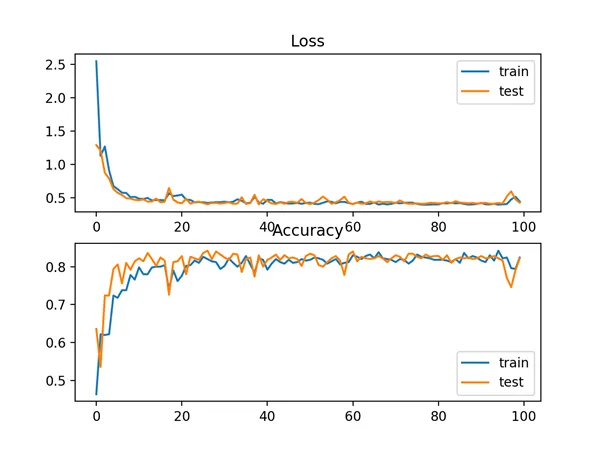
Line Plots of KL Divergence Loss and Classification Accuracy over Training Epochs on the Blobs Multi-Class Classification Problem