Plotting Detail
In the past, detail would have been plotted on paper or a more stable medium such as plastic film. However, today all practical ‘plotting ‘is computer based and there is now an abundance of computer plotting software available that will not only produce a contour plot but also supply three-dimensional views, digital ground models, earthwork volumes, road design, drainage design, perspective views, etc.
Computer systems
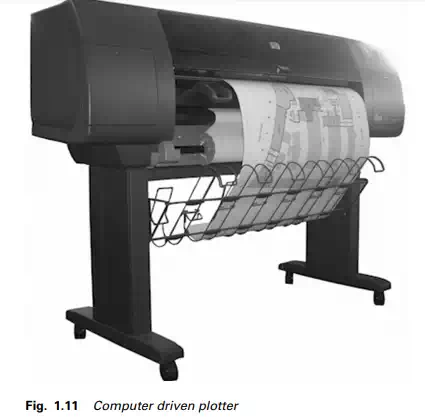
To be economically viable, practically all major engineering/surveying organizations use an automated plotting system. Very often the total station and data logger are purchased along with the computer hardware and software as a total operating system. In this way interface and adaptation problems are precluded. Figure 1.11 shows a computer driven plotter which is networked to the system and located separately.
The essential characteristics of such a system are:
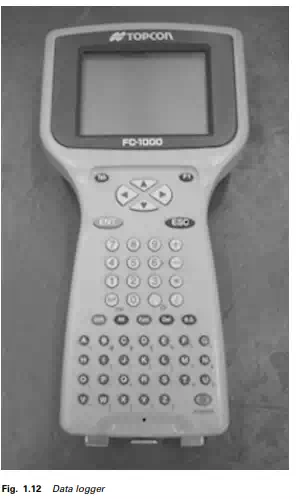
(1) Capability to accept, store, transfer, process and manage field data that is input manually or directly from an interfaced data logger (Figure 1.12).
(2) Software and hardware are in modular form for easy access.
(3) Software will use all modern facilities, such as ‘windows’, different colour and interactive screen graphics, to make the process user friendly.
(4) Continuous data flow from field data to finished plan.
(5) Appropriate database facility for the storage and management of coordinate and cartographic data necessary for the production of DGMs and land/geographic information systems.
(6) Extensive computer storage facility.
(7) High-speed precision flat-bed or drum plotter.
To be truly economical, the field data, including appropriate coding of the various types of detail, should be captured and stored by single-key operation, on a data logger interfaced to a total station. The computer
system should then permit automatic transfer of this data by direct interface between the logger and the system. The software should then: store and administer the data; carry out the mathematical processing, such as network adjustment, produce coordinates and elevations; generate data storage banks; and finally plot the data on completion of the data verification process.
Prior to plotting, the data can be viewed on the screen for editing purposes. This can be done from the keyboard or touch screen using interactive graphics routines. The plotted detail can be examined, moved, erased or changed as desired. When the examination is complete, the command to plot may then be activated. Figure 1.13 shows an example of a computer plot.
Digital ground model (DGM)
A DGM is a three-dimensional, mathematical representation of the landform and all its features, stored in a computer database. Such a model is extremely useful in the design and construction process, as it permits quick and accurate determination of the coordinates and elevation of any point. The DGM is formed by sampling points over the land surface and using appropriate algorithms to process these points to represent the surface being modelled. The methods in common use are modelling by ‘strings’, ‘regular grids’ or ‘triangulated irregular networks’. Regardless of the methods used, they will all reflect the quality of the field data.
A ‘string’ comprises a series of points along a feature and so such a system stores the position of features surveyed. The system is widely used for mapping purposes due to its flexibility, accuracy along the string and the ability to process large amounts of data very quickly. However, as the system does not store the relationship between strings, a searching process is essential when the levels of points not included in a string are required. Thus the system’s weakness lies in the generation of accurate contours and volumes.
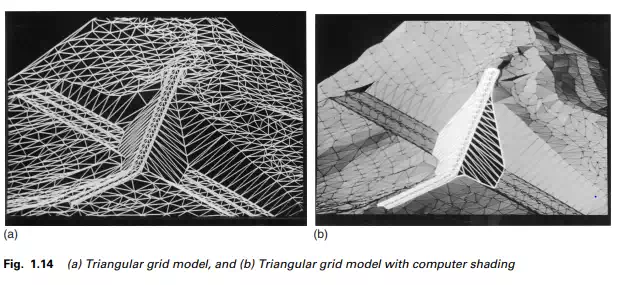
The ‘regular grid’ method uses appropriate algorithms to convert the sampled data to a regular grid of levels. If the field data permits, the smaller the grid interval, the more representative of landform it becomes. Although a simple technique, it only provides a very general shape of the landform, due to its tendency to ignore vertical breaks of slope. Volumes generated also tend to be rather inaccurate. In the ‘triangulated irregular networks’ (TIN) method, ‘best fit’ triangles are formed between the points surveyed. The ground surface therefore comprises a network of triangular planes at various inclinations (Figure 1.14(a)). Computer shading of the model (Figure 1.14(b)) provides an excellent indication of the landform.
In this method vertical breaks are forced to form the sides of triangles, thereby maintaining correct ground shape. Contours, sections and levels may be obtained by linear interpolation through
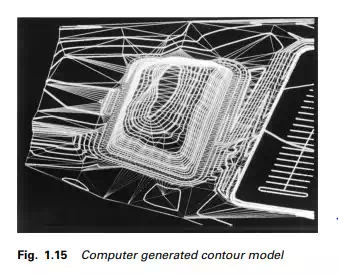
the triangles. It is thus ideal for contour generation (Figure 1.15) and computing highly accurate volumes. The volumes may be obtained by treating each triangle as a prism to the depth required; hence the smaller the triangle, the more accurate the final result.