Correlation Coefficient
Correlation coefficients are used in statistics to measure how strong a relationship is between two variables. There are several types of correlation coefficient: Pearson’s correlation (also called Pearson’s R) is a correlation coefficient commonly used in linear regression. If you’re starting out in statistics, you’ll probably learn about Pearson’s R first. In fact, when anyone refers to the correlation coefficient, they are usually talking about Pearson’s.
Correlation coefficient formulas are used to find how strong a relationship is between data. The formulas return a value between -1 and 1, where:
· 1 indicates a strong positive relationship.
· -1 indicates a strong negative relationship.
· A result of zero indicates no relationship at all.
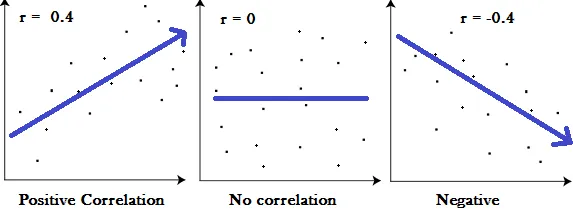
Graphs showing a correlation of -1, 0 and +1
· A correlation coefficient of 1 means that for every positive increase in one variable, there is a positive increase of a fixed proportion in the other. For example, shoe sizes go up in (almost) perfect correlation with foot length.
· A correlation coefficient of -1 means that for every positive increase in one variable, there is a negative decrease of a fixed proportion in the other. For example, the amount of gas in a tank decreases in (almost) perfect correlation with speed.
· Zero means that for every increase, there isn’t a positive or negative increase. The two just aren’t related.
The absolute value of the correlation coefficient gives us the relationship strength. The larger the number, the stronger the relationship. For example, |-.75| = .75, which has a stronger relationship than .65.