Sample Spaces and Events
Rolling an ordinary six-sided die is a familiar example of a random experiment, an action for which all possible outcomes can be listed, but for which the actual outcome on any given trial of the experiment cannot be predicted with certainty. In such a situation we wish to assign to each outcome, such as rolling a two, a number, called the probability of the outcome, that indicates how likely it is that the outcome will occur. Similarly, we would like to assign a probability to any event, or collection of outcomes, such as rolling an even number, which indicates how likely it is that the event will occur if the experiment is performed. This section provides a framework for discussing probability problems, using the terms just mentioned.
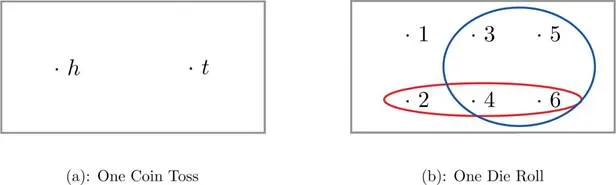
A graphical representation of a sample space and events is a Venn diagram, as shown in Figure 3.1 "Venn Diagrams for Two Sample Spaces" for Note 3.6 "Example 1" and Note 3.7 "Example 2". In general the sample space S is represented by a rectangle, outcomes by points within the rectangle, and events by ovals that enclose the outcomes that compose them.
Figure 3.1 Venn Diagrams for Two Sample Spaces
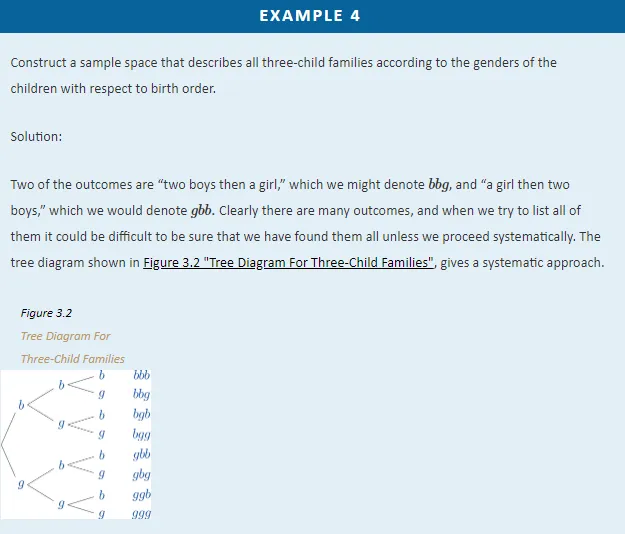
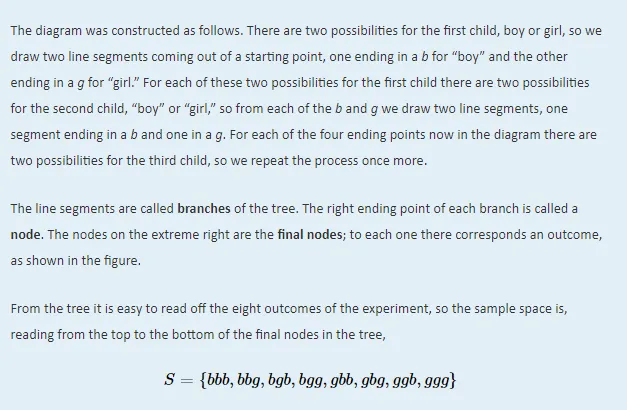
A device that can be helpful in identifying all possible outcomes of a random experiment, particularly one that can be viewed as proceeding in stages, is what is called a tree diagram. It is described in the following example.
The probability of an outcome e in a sample space S is a number p between 0 and 1 that measures the likelihood that e will occur on a single trial of the corresponding random experiment. The value p = 0 corresponds to the outcome e being impossible and the value p = 1 corresponds to the outcome e being certain.
The probability of an event A is the sum of the probabilities of the individual outcomes of which it is composed. It is denoted P(A).
The following formula expresses the content of the definition of the probability of an event:

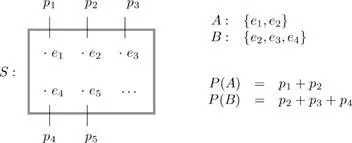
Figure 3.3 "Sample Spaces and Probability" graphically illustrates the definitions.
Figure 3.3 Sample Spaces and Probability
Since the whole sample space S is an event that is certain to occur, the sum of the probabilities of all the outcomes must be the number 1.
In ordinary language probabilities are frequently expressed as percentages. For example, we would say that there is a 70% chance of rain tomorrow, meaning that the probability of rain is 0.70. We will use this practice here, but in all the computational formulas that follow we will use the form 0.70 and not 70%.