Influence Lines
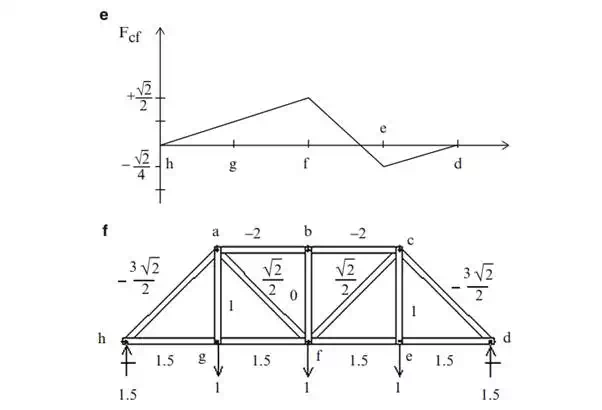
Consider the plane bridge truss shown in Fig. 2.26a. To design a particular member, one needs to know the maximum force in the member due to the design loading. The dead loading generally acts over the entire structure, i.e., on all the nodes. For this loading component, one places all the dead load on the structure and carries out a single analysis for the member forces. The live loading, by definition, can act anywhere on the structure and therefore one needs to determine the location of the live loading that produces the maximum force in the member that is being designed. A systematic approach to locating the critical position of the live loading is based on first constructing an influence line for the member force. This construction involves a series of analyses, one for each possible location of live loading. The live load is usually taken as a single force, of unit magnitude, which is moved from node to node across the structure. The resulting influence line is a plot of the member force as a function of the location of the applied load. Figure 2.26b illustrates the possible nodal positions of a vertical load applying to the bottom chord, and the corresponding member forces. Given this data, one can construct an influence line for any of the member forces.
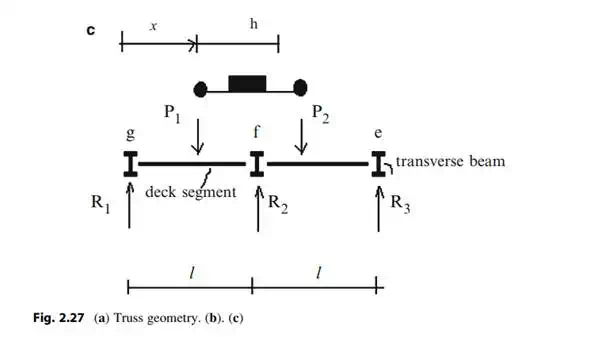
The process described above assumes the loading is a concentrated load applied at the nodes. For bridge structures, the live loading is actually applied to the deck which transmits the load to the transverse beams, and finally to the nodes. The deck is usually simply supported on the transverse beams, so the complete deck-beam system is statically determinate and one can determine the reactions at the nodes using only the equations of statics. We illustrate this computation using the structure shown in Fig. 2.27a. We suppose a truck loading is passing over the span.
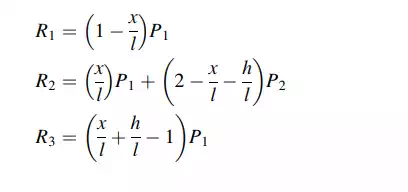
Consider the position shown in Fig. 2.27b. The wheel loads act on the deck segments gf and fe. The live load vehicle analysis reduces to just applying loads to the nodes adjacent to the vehicle since the deck segments (gf and fe) are simply supported. Noting Fig. 2.27c the equivalent nodal loads are



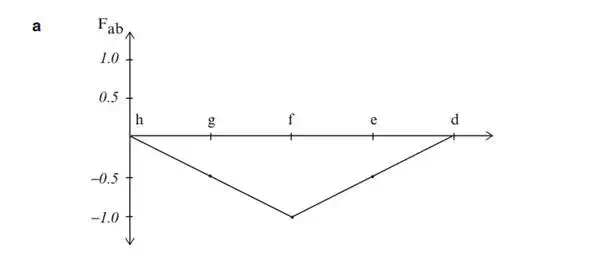
The most convenient way to present these results is to construct a plot of Fj vs. x where Fj is the force in member j due to a unit load at x, and x is taken to range over the nodes on the bottom chord. We need to apply these loads only at the nodes since the plot is linear between adjacent nodes. Plots of this type are called influence lines. Figure 2.28a shows the influence line for chord member ab. This visual representation is convenient since one can immediately identify the critical location of the load. For the chord member, ab, the maximum magnitude occurs when the load is applied at mid-span. Also, we note that the force is compression for all locations.
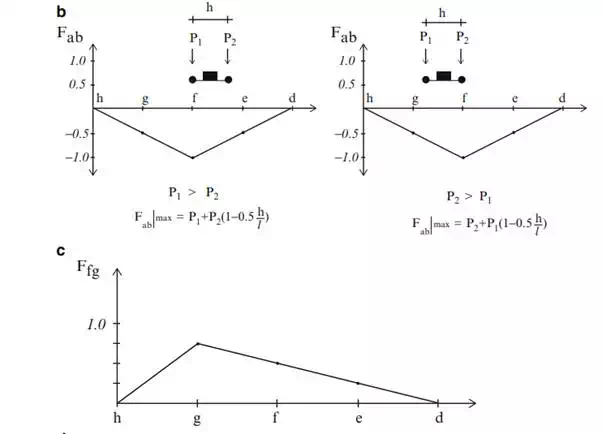
Given an actual loading distribution, one evaluates the contribution of each load, and then sums the contributions. If the actual live load consisted of a uniform loading, then it follows that one would load the entire span. The maximum force due to the truck loading is determined by positioning the truck loads as indicated in Fig. 2.28b. In general, one positions the vehicle such that the maximum vehicle load acts on node f.
The influence line for member fg is plotted in Fig. 2.28c. In this case, the member force is always tension.
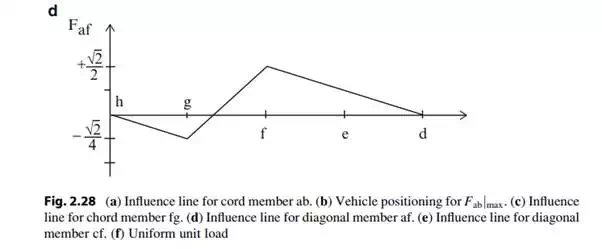
The function of the diagonal members is to transmit the vertical forces from node to node along the span. This action is called “shear.” The influence line for a diagonal is different than the influence lines for upper and lower chord members, in that it has both positive and negative values. Figure 2.28d shows the result for diagonal af. A load applied at node g generates compression, whereas loads at nodes f and e produce tension. Lastly, a symmetrically located diagonal with opposite orientation, such as cf vs. af has an influence line that is a rotated version of its corresponding member (see Fig. 2.28d vs. Fig. 2.28e).
Because the influence lines for diagonals have both positive and negative values, one needs to consider two patterns of live load in order to establish the peak value of the member force.
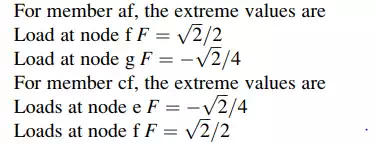
If a uniform load is applied, the peak force values for both members will be:

As mentioned earlier, diagonal members function to transmit vertical loads to the end supports. We showed above that the sense of the diagonal force depends on the orientation of the member. The sense of the diagonal force is important since slender members behave differently under compression vs. tension. A slender member subjected to compressive load will fail by buckling rather than by yielding since the buckling load is considerably less than the yield force. Therefore, from a design perspective one should avoid using slender compression members. For truss type structures, this problem can be avoided by selecting an appropriate diagonal orientation pattern.
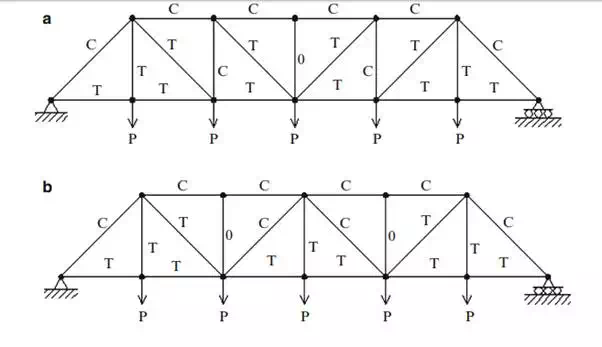
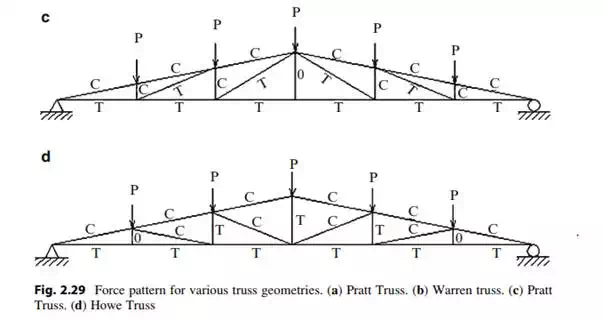
As an example, consider the two diagonal patterns shown in Fig. 2.29a, b. The sense of the member forces due to a uniform live load is indicated by C (compression) and T (tension). Pattern (a) is more desirable since all the interior diagonals are in tension. However, some of the vertical members are in compression.
Pattern (b) has alternating sense for the diagonals; the vertical hangers are all in tension. In general, for both truss types the top chord forces are compression and the bottom chord forces are tension. Figure 2.29c, d show similar results for inclined chord trusses. The designators “Pratt,” “Warren” and “Howe” refer to the individuals who invented these geometrical forms.
