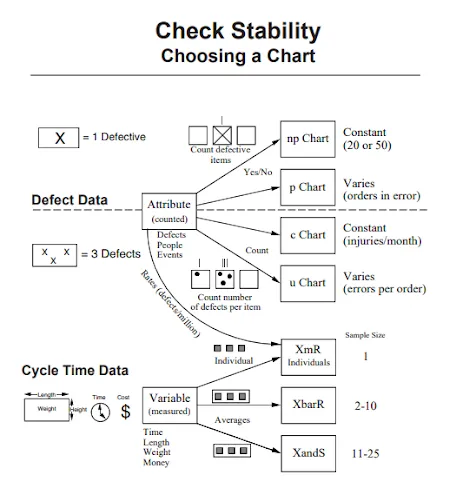
The selection of a right Control Chart depends upon the data types; what type of data we are going to use, what is our subgroup or sample size, etc. So what information do we need to check with the Control Charts? These charts can be selected or made by on the basis of the below mentioned charts:
A Control Chart is used to monitor, control and improve the process performance over time by studying the variation and its sources.
Control Charts are used to focus on detecting and monitoring the process variation over time. It helps us to keep an eye on the pattern over a period of time - variation, quantity, the current capability of your process and identify when some special events interrupt the normal operations. In the Improve phase, Control Charts are used to see the process improvement.
Since Control Charts and Run Charts show on-time passes, and reflect the improvement in the process while running the project. They are considered one of the best tools for analysis.
It monitors the progress and helps to learn continuously and quantify the capability of the process and evaluate the special causes happening in the process. It is typically part of the process management chart.
It is also used to segregate the difference between the common causes and special causes. We have already discussed in detail how and what control chart should we use. Given below are a few tips which we can be useful while using Control Charts.
Few tips and points to consider while using for Control Charts
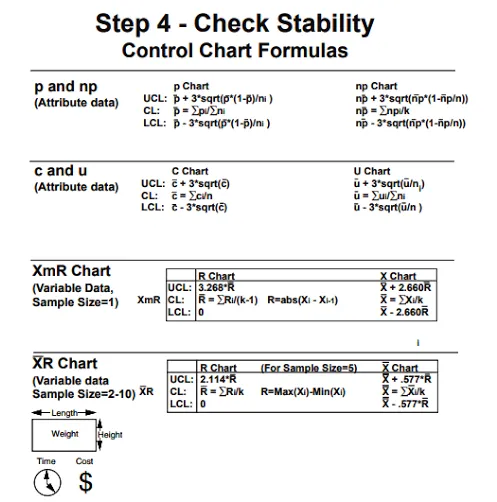
If LCL is negative, we can assume LCL as 0, instead of a negative value.
And for P and U chart, we know they vary with their sample sizes, for that we can take the average of their sample size to fix the sample size.
As we can see for continuous data, Control Charts exhibit two different charts, whereas for discrete data we can make a single Control Chart.
If the process is in control, which doesn’t mean that the product is meeting the expectations, it just means that it is consistent in performance.
Also, don’t get confused by control limits and specification limits. Specifications limits are given by the customer, whereas UCL and LCL are considered as the process variation limits.
Although the points which are on the outside of control limits indicate the special cause. The points which are on the inside of the limits give the indication that the data points are showing some trends, shifts, or sometimes instability.
For instance, if we remove the special cause, at that time we should not recalculate the control limits. For as long as the process is not changing, we should not change the process limits.
The Statistical Process Control(SPC) helps in reduction of the margin of errors since it is a kind of early warning system, which gives you an alarm for your process that in near future the process would go out of control if no preventive action is taken.
It also shows in what is the condition of the process whether it is under control or not and what circumstances make it out of control. Accordingly, we can take the action and avoid any chaos in the process.
To conclude we may say that a Control Chart is a boon for process improvement and helps to take the necessary preventive action for causes which can lead to the process going out of control. In this article, we have discussed the different types of Control Charts and their usages in the real world.
As a matter of fact, a Control chart should be used in some time interval to see the process performance, as it is like a health check-up of your process. In a Six Sigma project, we can use a Control Chart at the starting of the project as well as at the Improve phase to implement some necessary improvement steps and adopt some corrective measures to keep the project under control.