We can create a control chart while using the Minitab, we need to enter the data in Minitab and use the control chart as per data types.
If we do not have a Minitab, we can make it in Excel. In Excel, we need to enter all the data points and take out the average of data points, then find out the standard deviation with standard deviation formula. We go on till we reach 3rd standard deviation and then use the graph.
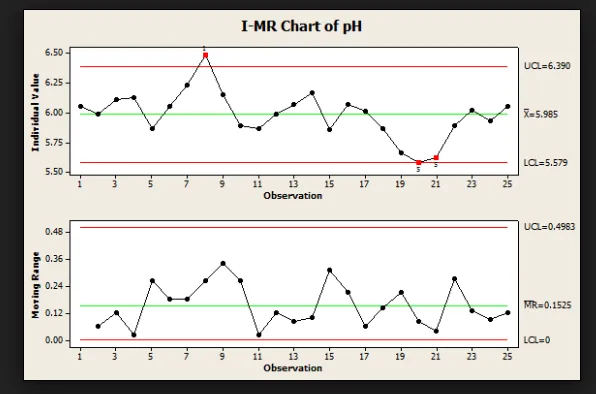
The above example is for a simple I-MR chart, which we can make and use it for continuous data types.
· We can use a Control Chart, at the starting of a project or whenever we want to see the VoP. While seeing the VoP we can even find the reason for running the project.
· We can see process improvement too by using a Control Chart towards the end of the project. This would also help in determining whether the project is successful or not.
· A Control Chart also helps in checking the process stability and verifying whether the process is stable enough to improve and make necessary improvements in the process wherever required.
Four Process States in a Control Chart
The 4 process states in a Control Chart are discussed below:
1. The Ideal state: This is where the process is in control and all the data points fall under the control limits. There is no non-conformance.
2. The Threshold state: Although data points are in control, or the process is stable, however, some non-conformance happen over a period of time.
3. The Brink of Chaos state: In this, the process is in control; however, it is on the edge of committing errors.
4. And the fourth stage is when the process is Out of Control and we have unpredictable non-conformance.
Control Charts are basically of 7 types, as it all depends upon the data type. If we have a continuous data type, then we can use 3 types of Control Charts i.e. I-MR Chart, X Bar R Chart,and X Bar S Chart.
If we have a discrete data type, then we use the 4 types of Control Charts: P, Np, C, and U Charts. All these types are described as below:
· I – MR Chart
We use the I-MR charts when we cannot do the subgrouping of the data, due to not much data points, or maybe the product takes long cycle time to produce, then we can use the I-MR chart, which means Individual Moving Range Chart. Here, at first we see the data points in the Control Chart and then their difference in the chart.
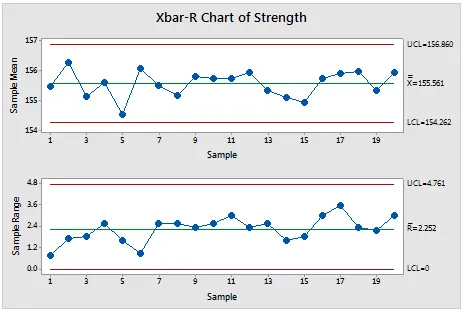
· X-Bar R Chart
When we have 2 or more than 2 subgroup size then, this is being used for continuous data. The standard chart for variables data, X-bar and R charts help to determine if a process is stable and predictable. In the X bar chart, X indicates the mean of all the subgroups in the chart, whereas R indicates the range of all subgroups in the chart.
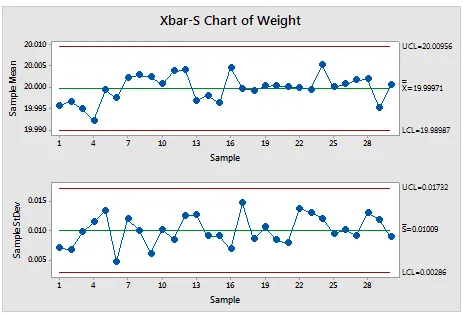
· X Bar S Chart
In the X Bar S chart, we use it to check the mean of the subgroups and the variation of the process. It is being used for more than 2 subgroups size and can also be used for more than 10 subgroups.
The above-mentioned charts are being used for continuous data. Let’s now move on to discrete data. For discrete data, we have 4 types of charts, since discrete data is segregated into two parts, (i) defects and (ii) defective and it varies depending upon the constant subgroup size.
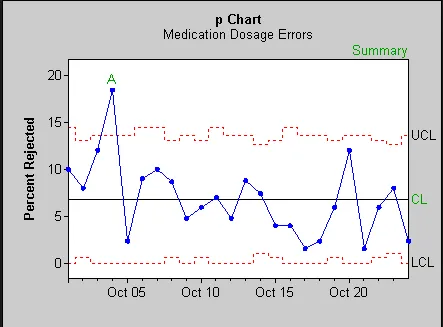
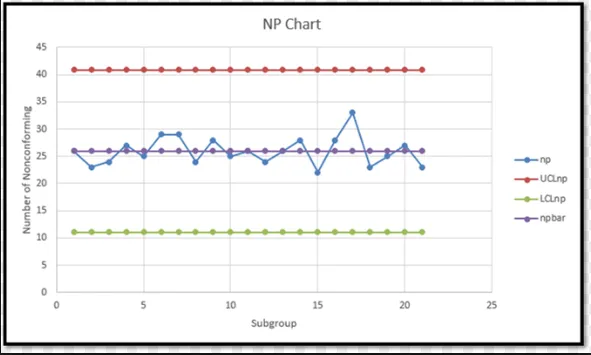
· P and Np Control Charts
The P and Np charts are used for defective data to check the process stability while seeing the defective data points. The main difference between the P and Np is P chart is used when sample size varies, whereas Np chart is used when the sample is constant.
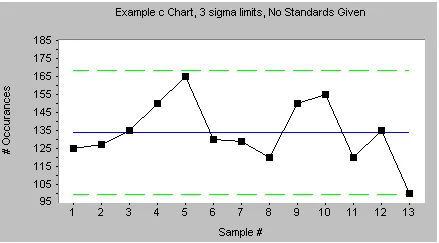
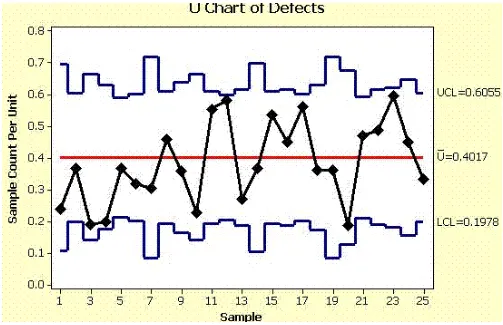
· C and U Control Charts
The C and U charts help to check the stability in a single unit, which might have more than one defect. For example, the number of defects in one pen. Here also, we can see the defects on the same size of the sample or it can vary on other samples.
C Control Chart is used when there is more than one defect and the sample size is fixed. While U Control Chart is used for more than one defect and if the sample size is not fixed.