A New Methodology for Kinematic Parameter Identification in Laser Trackers
The development of more accurate large-scale measurement systems is a critical need in the verification of large parts and facilities in sectors with high-quality requirements as in naval, aeronautic, or spatial industries. In these industries, dimensional accuracy of large parts needs long-range accurate measuring devices to ensure not only the parts right dimensions but also the precise positioning of every part in large assemblies.
Their applications are very wide such as large-volume measurements, inspection, calibration of an industrial robot, reverse engineering, analysis of deformations, machine tool volumetric verification, and so on.
The laser tracker (LT) offers significant advantages such as portability, flexibility, precision, or high-speed data acquisition. However, the mechanical assembly is an important source of errors such as offsets or eccentricities, which generates errors in measurements. A disadvantage of these measurement systems is that the user cannot know whether the LT is measuring correctly. Existing standards provide tests to evaluate the performance of the LT. However, these tests require specialized equipment with a high cost. In addition, they require long time-consuming and specialized equipment.
The calibration procedure identifies the geometric parameters to improve system accuracy. However, there are few studies about the calibration of LTs.
The basis of the calibration procedure is to determine the parameters of the geometric error model measuring a set of reflectors located at fixed locations from different locations of LT. One of the advantages of this method is that specialized equipment is not required so that any user of a measurement system could perform the LT calibration. Furthermore, the time required to calibrate the TL is considerably reduced and considerably compared with the time required to carry out functional tests recommended by ASME B89.4.19.
This chapter aims to present a method for performing a quick and easy calibration by measuring a mesh of reflectors to improve the accuracy of the LT. We have developed a kinematic error model and a generator of synthetic points to evaluate the procedure performance. Later, an experimental trial to identify the geometric parameters and a sensitivity analysis to determine the most appropriate instrument calibration measurement positions have been performed.
What a laser tracker is?
An LT is a
long-range metrological device with an accuracy of some tens of micrometers.
The LT is composed of an interferometer mounted on a two degrees of freedom
rotatory gimbal. The laser beam reflects in a spherically mounted
retroreflector (SMR), which returns the beam to the interferometer. Any
displacement of the SMR is detected by position sensitivity devices, which
adapt the LT position to follow the SMR position. The distance measured by the
interferometer, (d), along with the readings of the encoders placed in
each one of the two rotatory axes, (θ, ϕ), gives the spherical
coordinates of the SMR centre referring to the LT reference system as shown in Figure 1. Knowing
the spherical coordinates, the corresponding Cartesian coordinates can also be
calculated based on Eqs. (1)–(3).![]()
![]()
![]()
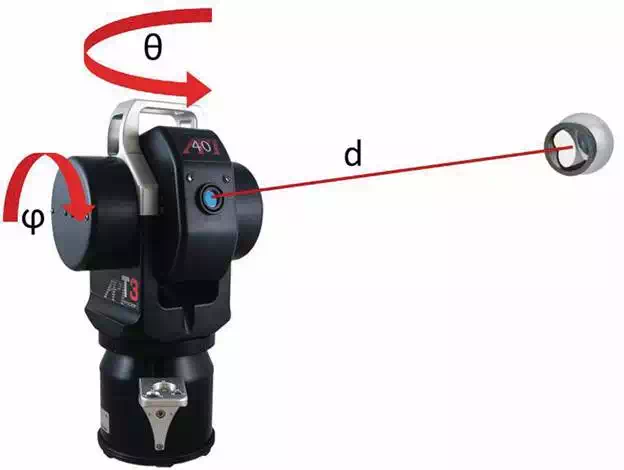
FIGURE 1.
Laser tracker working principle.
Laser tracker kinematic model
The LT can be considered as an open kinematic chain with three joints: two rotary joints in the gimbal and a prismatic joint corresponding to the laser beam. The kinematic model is a mathematical expression that determines the position of the final joint of the kinematic chain (the SMR centre) with reference to the LT frame. We have used the Denavit-Hartenberg (D-H) formulation to develop the kinematic model. This method defines the coordinate transformation matrices between each two consecutive reference systems j and j − 1 as the product of the rotation and translation matrices from j − 1 joint to j joint. The DH model needs four characteristic parameters (distances dj, aj, and angles θj, αj) for these matrices. Figure 2 shows the relationships between the consecutive reference systems. Knowing the kinematic parameters corresponding to every joint, the homogeneous transformation matrix from reference system j to j − 1 is the result of the product of the four rotation and translation matrices shown in Eq. (4).

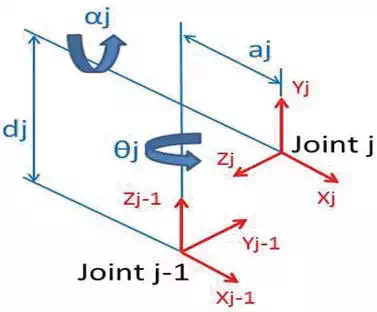
FIGURE 2.
Denavit-Hartenberg model.
Being Tm,n and Rm,n, the homogeneous translation matrices corresponding to translation (T) or rotation (R) n along axis m.
Following the DH model, the LT kinematic model has been determined as shown in Figure 3. The position of the reflector referring to the LT reference system is defined by Eq. (5).
![]()
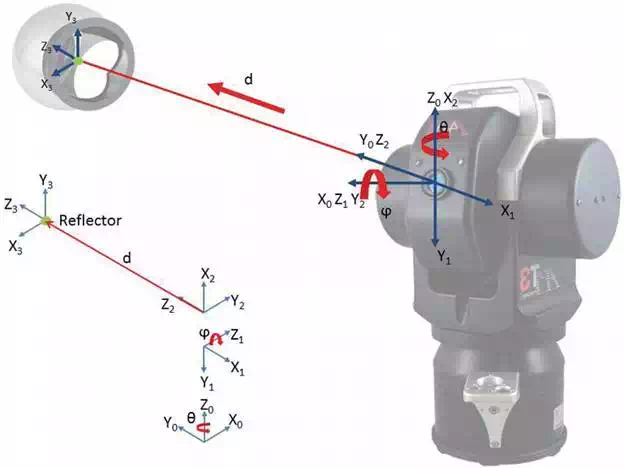
FIGURE 3.
Laser tracker kinematic model.
This chapter is based on the LT API Tracker 3. Table 1 shows the kinematic parameters corresponding to this LT model.
|
i |
αi (°) |
ai (mm) |
di (mm) |
θi (°) |
|
1 |
−90 |
0 |
0 |
θ − 90 |
|
2 |
90 |
0 |
0 |
ϕ − 90 |
|
3 |
0 |
0 |
d |
−90 |
TABLE 1.
Laser tracker kinematic parameters.
Laser tracker error model
Relative positions between two consecutive joints are defined by the DH model. These are the nominal positions, but they are conditioned by the LT errors. This means that reference frames are not at its expected position as shown in Figure 4. An error model that fits the geometry of the joints is necessary to modify the kinematic model.
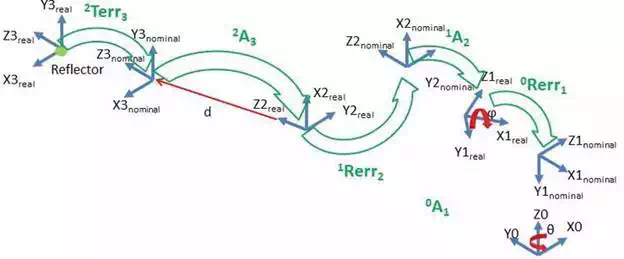
FIGURE 4.
Error model.
In this chapter, the error model shown in Figure 5 has been used. This model is based on six degrees of freedom error for each joint. Mathematically, the error is stated as a transformation matrix between the nominal joint frame and the real frame. The matrices are different for rotary joints (Eq. (6)) and linear joints (Eq. (7)). For each error matrix, a new set of six error parameters is defined (δx, δy, δz, εx, εy, εz). The calibration procedure will calculate the optimum parameter values to minimize the LT error.
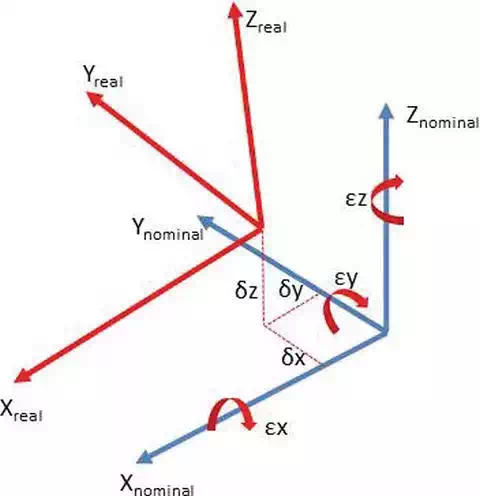
FIGURE 5.
Error parameters.


Including the error matrices in Eqs. (5) and (8), which describes the kinematic model with the error model, is obtained.
![]()
By checking the behavior of the error model, it has been proven that errors depend on the joint position (the rotation angle in rotary joints and distance of the interferometer). This means that error parameters must have a formulation depending on the joint position. For the error parameters corresponding to the linear error matrix, we have used a polynomial function (see Eq. (9)) and for the error parameters corresponding to the rotary error matrices, a Fourier shape function is more convenient because of its periodic behavior (see Eq. (10)).
![]()
![]()
For φ = δx, δy, δz, εx, εy, εz.
Model validation
The kinematic error model must be validated. The validation has been performed first with synthetic values and then with real values.
SYNTHETIC DATA VALIDATION
A parametric generator of meshes of reflectors with known errors has been programmed. This algorithm generates a mesh of synthetic reflector coordinates with nominal position values. Then a set of error parameters is introduced, and the theoretical measurements of an LT, affected by the error parameters introduced, are calculated.
These measurements are introduced in the calibration procedure to calculate the error parameters with the optimization of the function described in Eq. (11) and correct the measurements.
Finally, the initial measurements and the corrected ones are compared with the nominal reflector positions according to Eq. (12) to calculate the calibration accuracy improvement achieved.

![]()
The error parameter set is shown in Table 2.
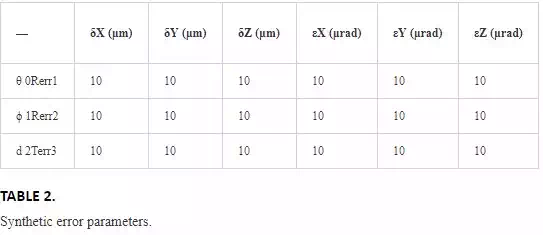
Three meshes of synthetic reflectors have been generated:
Flat YZ plane mesh 15 × 14 = 210 reflectors (Figure 6).
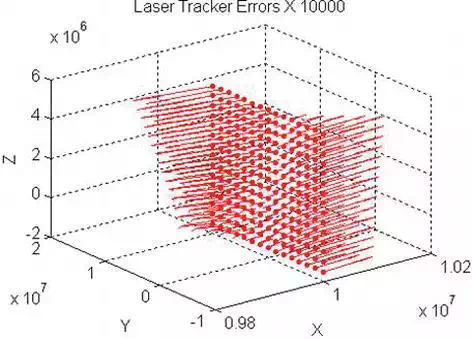
FIGURE 6.
Errors in a plane mesh.
X = 5.000 mm constant.
Y = 10.000 ÷ 10.000 Δ 1.420 mm.
Z = 1.500 ÷ 5.000 Δ 500 mm.
Cubic XYZ mesh 6 × 6 × 6 = 216 reflectors (Figure 7).
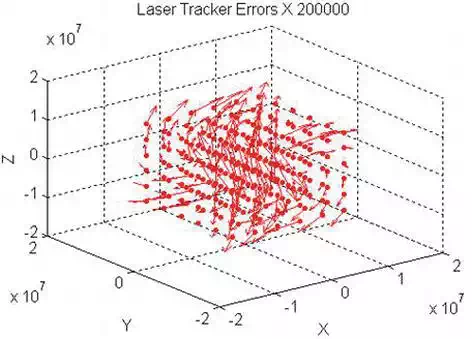
FIGURE 7.
Errors in a cubic mesh.
X – 10,000 ÷ 10,000 Δ 4,000 mm.
Y – 10,000 ÷ 10,000 Δ 4,000 mm.
Z – 10,000 ÷ 10,000 Δ 4,000 mm.
Spherical HVR mesh 12 × 8 × 5 = 480 reflectors (Figure 8).
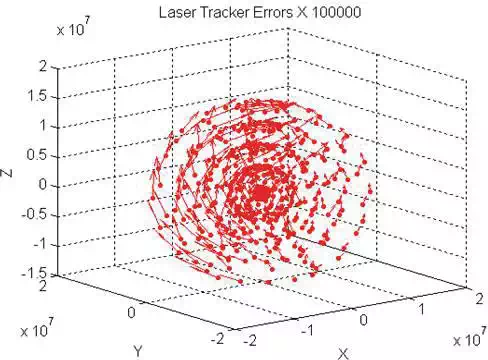
FIGURE 8.
Errors in a spherical mesh.
H 0° ÷ 360° Δ33°.
V 77° ÷ − 60° Δ20°.
R 1,000 ÷ 15,000 Δ 3,500 mm.
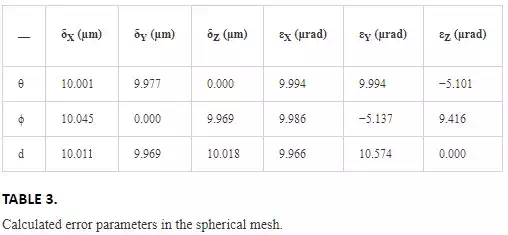
The calibration procedure calculates the parameter errors and corrects the generated measurements. As the error parameters are calculated through a mathematical optimization, the result do not gives exactly the nominal parameters but provides a set of parameters that minimizes the LT error. In fact, the calibration reduces the LT error more than 98%. For example, Table 3 shows the calculated error parameters corresponding to the spherical mesh.
REAL DATA VALIDATION
The validation with synthetic data shows that the programmed algorithms are working properly but, as the errors have been generated with the error model purposed, it was expected to obtain a good calibration result. It is necessary to check the calibration behavior with real data. To do it, an experiment has been performed. A set of 17 reflectors has been placed over the table of a coordinates measuring machine (CMM). Then the positions of these reflectors have been measured with the CMM and the LT from five different positions as shown in Figure 9.
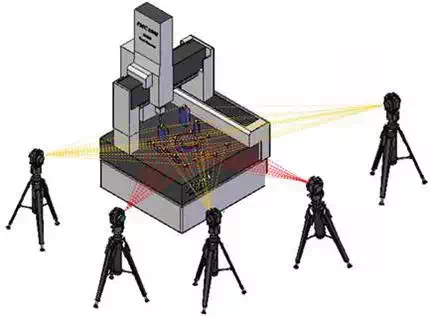
FIGURE 9.
Real data validation experiment.
The estimation of the error parameters have been performed on the basis that the distances between every pair of reflectors must be the same regardless the LT position from which they have been measured. Eq. (13) compares the distances measured by the CMM and the LT.
![]()
Being dmik, the distance measured between the i-esim pair of reflectors from the k-esim LT position and diCMM the same distance measured by the CMM. Cn,r is the number of possible pairs of reflectors. In this case i=C2,17 = 136 pairs of reflectors. Figure 10 and Table 4 show the initial and residual errors of the reflectors mesh.
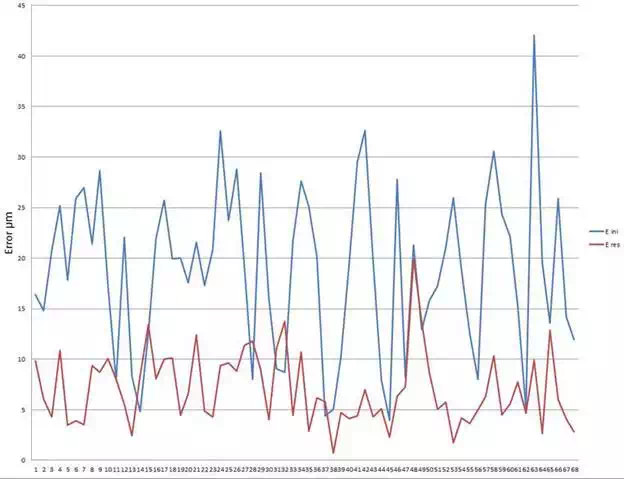
FIGURE 10.
CMM reflectors mesh calibration.
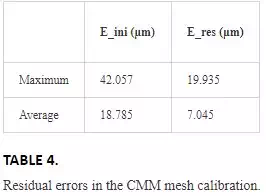 .
.
In the real calibration object of this work, we measure a mesh of reflectors out of the metrological laboratory, and there will be no nominal data to calculate the error parameters. To simulate the calibration procedure behavior and its requirements under real conditions, we have used the CMM measurements with a new optimization function. This function is equivalent to Eq. (11) but instead of comparing CMM and LT distances, we compare distances from every pair of LT positions as shown in Eq. (14).
![]()
With this optimization criterion, we found out that calibration result increased the LT error. That is due to the fact that the mathematical optimization matches the distances but to a value different from the nominal. This means that it is necessary to introduce a calibrated distances gauge in the reflectors mesh to determine its behavior. After several simulations, a gauge of four reflectors gives the best results, and the objective function is as shown in Eq. (15)
![]()
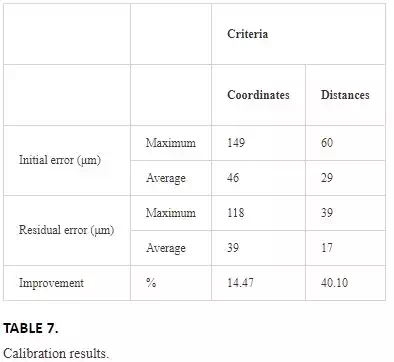
To evaluate the calibration results, we have established two different criteria: (1) a distances criterion that evaluates the differences of distances between every pair of reflectors measured from every pair of positions of LT according to Eq. (16) and (2) a coordinates criterion that evaluates the position error for every reflector measured from every LT position (see Eq. (17)). This second criterion requires first to transform all measurements to the same reference system.


The results of the calibration following both criteria are shown in Tables 5 and 6.
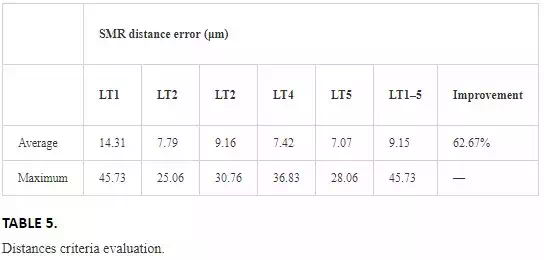
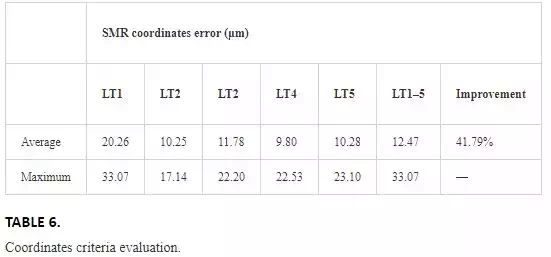
Sensitivity analysis
In order to know the SMR positions more appropriate to perform the calibration, a sensitivity analysis has been performed. In this analysis, the influence of every error parameter in the global LT measuring error has been analyzed. Using the synthetic data generator, many synthetic measurement meshes as error parameters that have been considered in the error model have been generated. Thus, 18 meshes are necessary. All of them have been generated with the same nominal coordinates as the spherical mesh generated in the synthetic data validation in chapter 5.1 and every mesh is affected by a single error parameter with a value of 1µm for linear error parameters or 1µrad for angular error parameters.
Figure 11 shows the error produced by every error parameter through the spherical mesh.
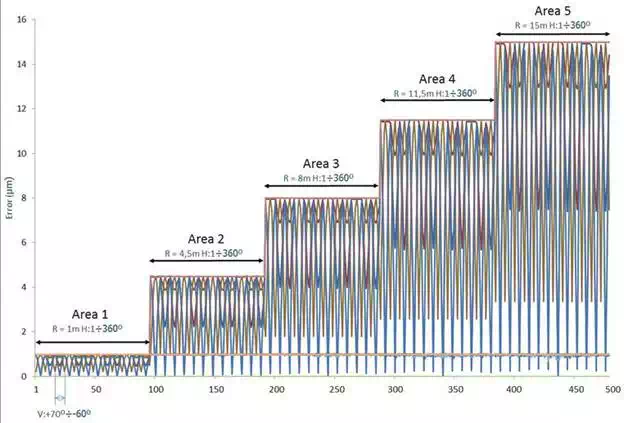
FIGURE 11.
Sensitivity analysis.
As a result, it is deduced that all distance error parameters (δ) produce constant errors. Errors due to parameters εx1, εy1 and εz1 depend on θ, ϕ and d, errors due to parameters εx2 and εy2 depend on ϕ and d and errors due to parameters εz2, εx3 and εy3 depend only on d. Finally, parameter εz3 produces no errors. Taking a closer look at the parameters that produce variable errors, we can see in Figure 12 that the maximum and minimum error values correspond to maximum, minimum and zero values of ϕ and also on θ every π/4.
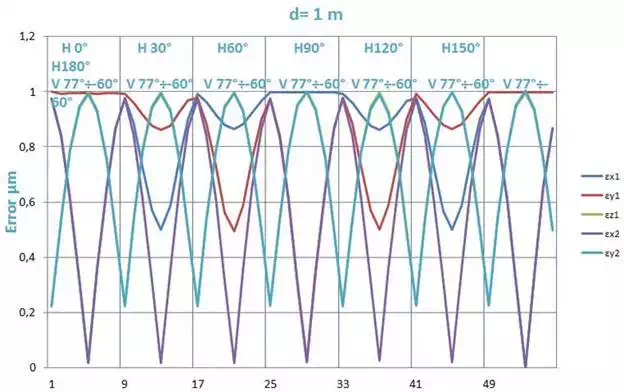
FIGURE 12.
Sensitivity analysis of variable errors.
Experimental setup
The sensitivity analysis proves that extreme and zero values of tilt angle are the best. It also proves that pan angle ranges must be at least 90°. According to these requirements, 24 reflectors have been placed in a corner of the laboratory. Eight of them spread on the floor (minimum tilt angle), a second set of eight reflectors on the wall at the LT height (zero tilt angle) and the last eight reflectors in the upper part of the floor (maximum tilt angle). LT has been placed at five different positions covering always a pan angle of 90° as shown in Figures 13 and 14.
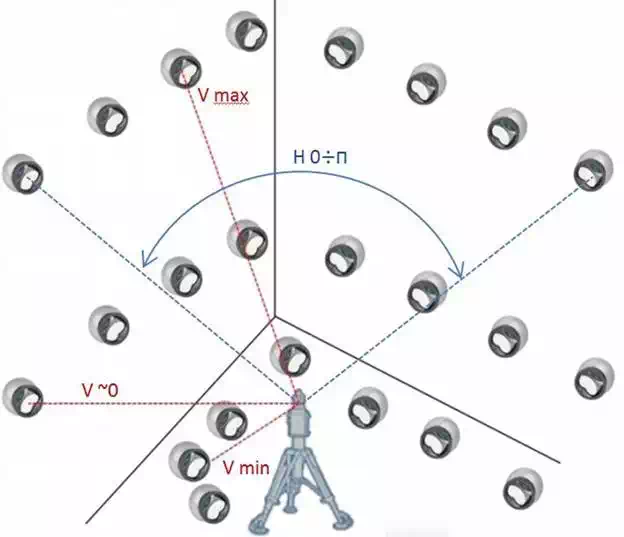
FIGURE 13.
Calibration experimental setup.
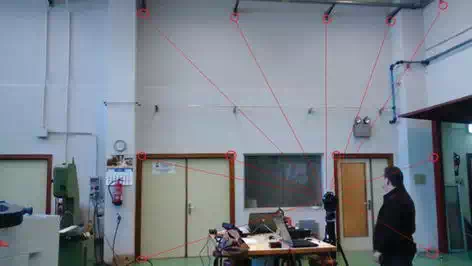
FIGURE 14.
View of the experimental calibration process.
Calibration results
The calibration has been performed following the model in Eq. (15) and evaluated according to Eqs. (16) and (17) in the same way as it has been done with the CMM measurements. A gauge of four reflectors has been also included in the mesh of reflectors, and this gauge has been measured in the CMM to know the real distances among its reflectors.
Figures 15 and 16 show the calibration result. In Table 7, the numerical values of the calibration in function of the evaluation method can be appreciated.
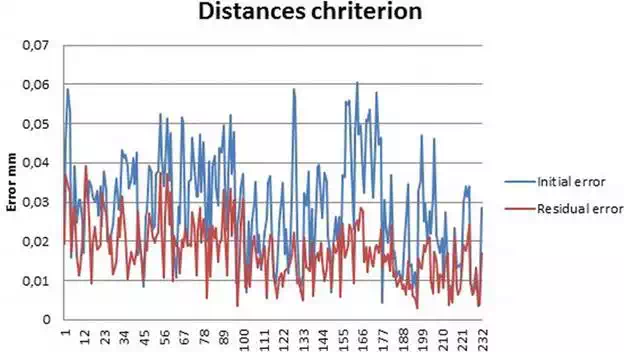
FIGURE 15.
Calibration results distances criteria.
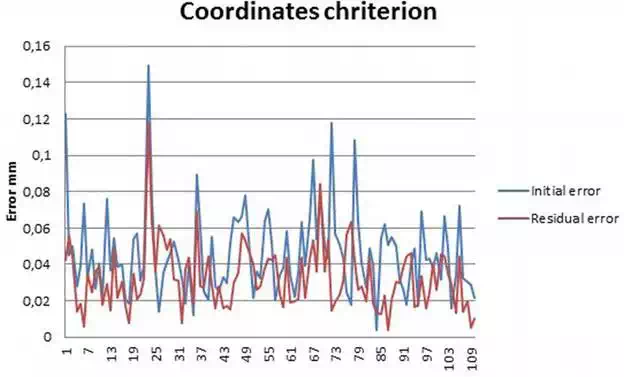
FIGURE 16.
Calibration results coordinated criteria.
Calibration verification
Calibration results show an LT accuracy improvement according to both criteria used, but as we do not have the SMRs real positions, it is not possible to ensure without any doubt that the calibration procedure increases the LT accuracy.
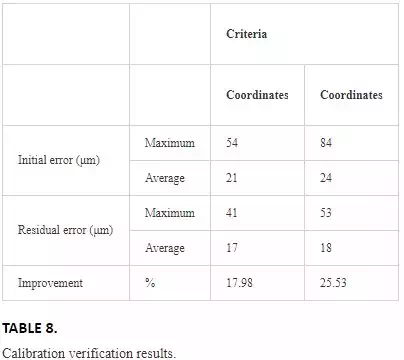
A new verification is therefore necessary to assess the calibration procedure behavior. In Section 5, a set of SMRs has been measured with the LT from five different positions. These SMRs were placed on a CMM table and measured also with the CMM. These accurate measurements can be used as nominal data to check whether the calibration has improved the LT accuracy or not. The error parameters obtained in the calibration procedure have been applied to the measurements made in the CMM table. The corrected values can be then compared to the CMM nominal measurements and can be seen in Figures 17 and 18 and its values in Table 8.
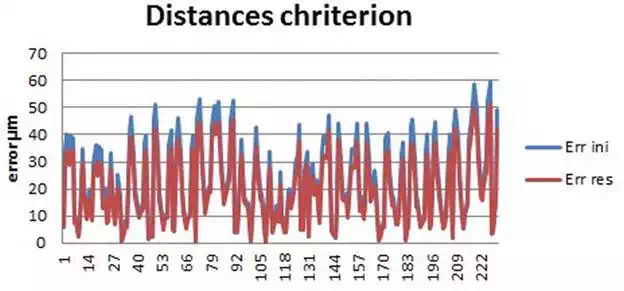
FIGURE 17.
Calibration verification distances criteria.
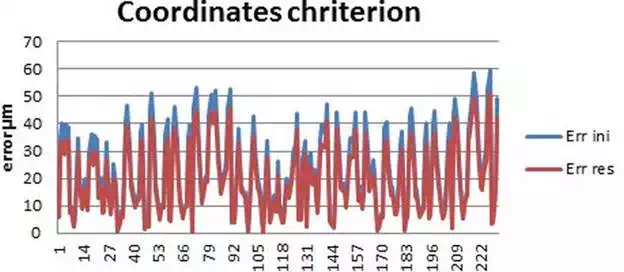
FIGURE 18.
Calibration verification coordinates criteria.
Contribution of the SMR incidence angle in the measurement uncertainty
In some of the measurements made, the position of the SMR could not be reached by the LT beam. The SMR maximum viewing angle is within ±30°, and they were placed facing a theoretical point in the middle of the LT selected positions. However, as the SMR positions and orientations are fixed along all the measurements, and they are manually placed, there is the possibility that some of them could not be visible from all the LT positions because the incidence angle was out of the SMR viewing range.
The incidence angle of the laser beam in the SMR has an important influence in the measurement accuracy, and an experiment has been performed to measure the contribution of the SMR incidence angle in the measurement uncertainty.
An SMR with its magnetic holder has been placed on a rotary worktable. The SMR has been centred; so its centre will be in the worktable rotation axis. The SMR was centred using the rotary worktable pencil and its centring accuracy has been measured to be in the range of ±0.1 μm.
The SMR has been initially located with its incidence angles equal to 0° facing to an interferometer laser beam. The interferometer measurement has been then reset to make this position as the zero length measurement.
The SMR has been then rotated on its horizontal and vertical angles within its incident available range of ±30° in 7.5° steps as shown in Figure 19.
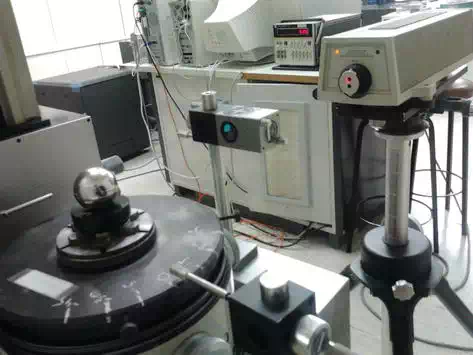
FIGURE 19.
SMR incidence angle error measurement.
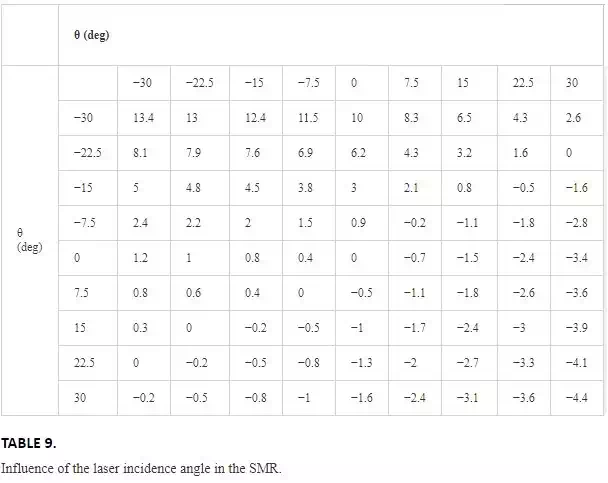
Data measured by the interferometer are shown in Table 9. An important dependence on the angle variation can be seen, showing the influence of the vertex position error, that is, the distance between the optical centre of the CCR and the SMR sphere.
Conclusions
A new LT kinematic calibration has been presented and verified by comparing calibration results with nominal data measured with a CMM. The novelty of the method is that a final calibration of the LT can be made by the LT user at place just before measuring with the LT under real working conditions. This can greatly help LT measurement process by assuring a correct calibration at the moment of measuring. The only devices needed for the calibration is a calibrated gauge and a set of reflectors to be located at the measuring place.
The kinematic error model has been defined. This model has also been validated with synthetic and nominal data. The study of the influence of every error parameter in the global error of the LT has shown the best configuration for the experimental setup.
The calibration procedure has been performed with a previously calibrated LT, and the calibration has been able to improve the factory calibration of the LT.
The influence of the laser incidence angle in the measurement uncertainty shows an important contribution to the measurement errors.
The kinematic calibration model developed offers important advantages compared to the conventional methods. Existing standards require strict temperature conditions, and a large number of measurements are needed to perform the calibration. The purposed method can be used in two ways; first, the distance error calculated for every pair of reflectors measured from different LT locations gives a dimensional value of the LT accuracy, which will help the user to know whether a calibration of the device is necessary or not. In other way, if the calibration is necessary, it can be performed by the final user between the programmed calibrations without the need of a metrological laboratory. It can also be used to develop new calibration standards or complete the existing ones.
Future work
It is possible to find two constructive LT models from different manufacturers. The purposed method is valid for the LT having the laser source in the rotating head. The other model is characterized by having the laser source in the fixed basis of the LT. This means that they need a rotating mirror attached to the standing axis to reflect the laser beam from the source to the SMR. The calibration procedure followed in the present work can also be applied to this second LT constructive model adapting the kinematic model to the LT geometry and the laser beam path.
Along with the development of this kinematic model, further tests are convenient to study the behavior of the calibration method under different conditions such as measurement range, temperature, number and distribution of reflectors.