ADAS-Assisted Driver Behaviour in Near Missing Car-Pedestrian Accidents.
It is commonly acknowledged that in the near future most of the road vehicles will travel, on almost the totality of the road network, in an automated way (autonomous driving). The reason for such a forecast is easily understood: the influence of the driver on safety, energy efficiency and traffic fluidity is very high [1]. In fact about 93% of road accidents are originated by some kind of driving error, as recognition errors, decision errors and performance errors [1]. Under such point of view, automated driving can bring dramatic improvements by eliminating the influence of human factors, thus contributing to reduce serious and fatal road accidents, fuel waste and traffic congestion. The total elimination of road accidents, however, is not predictable at the moment, but their reduction to very little numbers is reasonably attainable. In the vision of many researchers, a roadmap to full automated vehicles can be defined; for instance, organisation like the Society of Automotive Engineers (SAE) has defined some steps (SAE Level of progressive automation, Figure 1), ranging from Level 0 (no automation) to Level 5 (full automation) [2].
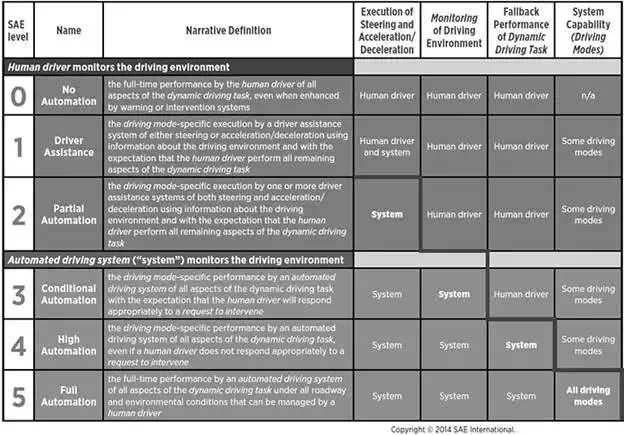
FIGURE 1.
SAE levels of progressive automation as defined in SAE International Standard J3016.
Levels 02 (partial automation) require that the human driver be responsible for monitoring the driving environment, whereas in Levels 35 such task is performed by the automated driving system. Unless having reached a condition of full automation (Level 5), the driver must be involved in car driving, that is to say that the driver must be kept in the loop. In fact in any intermediate level of automation, several driving modes will include the possibility or the necessity that the control of the vehicle is shifted from the automated system to the driver, or that the driver is willing to keep the control back. As explained in Refs. [3, 4], such operation must be carefully designed. Such issue will be particularly important in the case of Level 3 (conditional automation) in which the driver, due to the increasing number of automated driving modes, will be often called to take the control back. The driving task can be decomposed into three main activities: recognition, judgement and operation. In all of such activities errors are possible, likely to bring to some risks or even to accidents. Within SAE Level 0 (no automation), all of these tasks are performed by the driver, which can be defined as conventional driving. If the implementation of Advanced Driver Assistance Systems (ADAS) is carried out, the driver can be assisted, or even substituted, by some automated or autonomous device or function, up to a level of full automation (SAE Level 5) in which recognition, judgement and operation are performed by the system taking full control. In intermediate levels of assistance (as, for instance, in SAE Levels 1 and 2) only recognition and/or judgement are assisted so that the responsibility for operation remains with the driver. Far from being infallible (at least at the present state of the art) such devices can be of great help to decrease the probability of errors and, consequently, of accidents.
PRESENT ADVANCED DRIVER ASSISTANCE SYSTEMS
As regards the present state of the art of driving assistance devices, their functions can be divided into three main categories:
● Presentation of information about road environment and traffic conditions; the driver is helped during his recognition activity. Under this category, devices, such as road sign recognition (RSR), blind spot monitoring systems (BSM), and so on, can be included.
● Warning; the driver is helped as regards judgement. A timely and appropriate warning signal is issued when a possibly critical situation is detected (as forward collision warning (FCW)).
● Control (to help the driver in operation tasks); the system gets control over the vehicle.
Presently, two types of control can be considered:
● Control for normal driving conditions (as, for instance, lane keep assist (LKA), adaptive cruise control (ACC), etc.), mainly aimed at improving travelling comfort by reducing the workload on the driver.
● Control for pre-crash conditions (as autonomous emergency braking (AEB), often in combination with FCW) in which the driver may be overridden due to the lack of an effective response to some critical situation, aiming at avoiding or mitigating an imminent collision. In such cases, the system acts on the brakes but leaves the choice of steering to the driver.
Even if the control is took by the system, the driving responsibility remains to the driver: in the first case because the control is handed to the driver when conditions can become critical; in the second case, the driver is overridden only at pre-crash conditions (but only as regards braking) so that the accident consequences are mitigated.
In all of this assistance functions, it can be easily understood that a convenient interface (Human-Machine Interface (HMI)) between the generic device and the driver must be designed and implemented. HMI can be considered as the channel through which information are conveyed to a vehicles occupant; HMI design is one of the main issues that must be properly allowed for [5], addressing, for instance, the definition of the correct stimulus (type: visual, acoustic, haptic, etc.; sequence; timing; priority; etc.). In addition, since it is to be expected a different communication efficiency as a function of age, experience, education, etc., the interface must be properly tailored and some adaptation is certainly needed. The necessity of standardisation is to be expected, as well as the definition of human models capable to help interpreting correctly the situation and act accordingly.
During the progression towards full automation (especially when high levels of automation, such as SAE Levels 2, 3 and 4, will be implemented), several issues should be addressed in order to obtain a fast and successful path to SAE Level 5; three main topics can be identified as follows:
● Definition of suitable strategies for shifting control from the driver to the system and vice versa. Design of proper HMI systems will be of fundamental importance, also aiming at carrying out such operation in a seamless manner.
● Definition of procedures aimed at obtaining the functional assessment of the instrumental part of the automated system.
● Obtaining a wide user acceptance rate in order to accelerate the penetration in the market of automated systems.
The issues presented in the first two points are currently addressed by several standard practice and regulations (as, for instance, in [6, 7]).
Presently, most of the vehicles can be categorised as belonging to Level 0 of automation, but all the major car manufacturers (as well as tier one suppliers) offer, in their sales catalogues, devices that can be defined as Driver Assistance Systems (typical of SAE Level 1) and some of them show features that can be defined as partial automation.
In the Italian market, for instance, in the official sales catalogues of the end of 2015 as published by car magazines (basically Quattroruote, Italy), several automated assistance systems can be found, mainly belonging to the following categories:
● Adaptive cruise control (ACC),
● Blind spot monitoring systems (BSM),
● Lane departure warning systems (LDWS),
● Road sign recognition (RSR),
● Autonomous emergency braking/forward collision warning (AEB/FCW).
It can be easily recognised that such functions will certainly be part of a hypothetic future full automated system: even if the methods used to obtain such functions are hardly imaginable, the functions itself are necessary and the interaction with the driver must be allowed for. As can be seen in Table 1, the above-mentioned devices are offered by a good number of manufacturers on several models, both as standard equipment and as paid option; often they are included in a package together with other safety or comfort devices.

Table 2 shows average price and standard deviation (SD) for the same devices as Table 1, for the models offering such devices as paid option; as can be seen, when a device is included in a package, its price can be much higher. Price is a matter that can influence user acceptance and delay the diffusion of such safety devices.

USER ACCEPTANCE
Though many researchers are very optimistic on the large implementation of full automation in the near future [8], many factors can slow down the process. A survey conducted by IEEE among its members [8] revealed that in the vision of many experts in the field, six main obstacles to the rapid diffusion of autonomous vehicles can be identified, i.e., technology, cost, infrastructure, policy, liability and user acceptance. According to this source, the first three points should represent a minor problem; technology is rapidly improving as regards both efficiency and reliability, whereas cost is a problem that must be shared among private and public stakeholders, also taking into consideration the potential benefit of accidents reduction, as well as medical and social costs. The implementation of proper infrastructures is of the greatest importance (it is difficult to imagine an effective implementation of driving automation without, e. g., V2V and V2I communications) so that in relatively short terms it can be predicted that the largest diffusion of such systems will take place first in advanced geographical areas, such as North America, Europe and parts of Asia. The last three points, instead, will play a decisive role; policymakers can boost or slow down the process since many matters require political decisions and a proper legislation will most probably be necessary, for instance as regards the realisation of the needed infrastructures and the settlement of issues related to legal liability. This last point can be particularly important: who will be responsible when an accident happens, as certainly will? It can be imagined that the involvement of car manufacturers and their suppliers will be greater, in a context that will also involve insurance companies, governments and customers [911]. User acceptance will play a fundamental role; in reference [12], for instance, a worldwide survey was carried out in order to understand how autonomous vehicles will be accepted, comparing all levels of automation (from conventional driving to full automation). In this study, the major concerns of future customers were indicated, including legal issues, cost (22% declared themselves unwilling to pay any additional sum for an automated vehicle), security (regarding especially software being subject to hacking), privacy concerns (vehicles are subject to be constantly monitored) and driving pleasantness, etc. Geographical differences were also pointed out. In reference [13], the intention of French drivers to use a partially or fully automated vehicle was investigated. In reference [14], the possible effect of motion sickness on user acceptance is investigated, and the necessity of considering such issue during the design and development phase is emphasised. Thus, if a fast and successful introduction in the global market is desired, such systems must be implemented in such a way as aiming at high performance and high user acceptance, and such steps require the most complete understanding of driving behaviour: in other words, a driver model (or better, driver models) must be set up.
THE ROLE OF SIMULATION
In the initial phase of the development of ADAS, it is a common practice to carry out testing in controlled environment, namely, by staged driving sessions or using driving simulators. Since their introduction, driving simulators have been widely used to study safety and human factor-related issues. Since the first appearance of advanced driving simulators they were extensively used to investigate over safety issues [15, 16] and also as an important tool in the design and assessment of advanced driving assistance systems [17, 18].
The use of simulators presents numerous advantages:
● Situations that normally reveal to be dangerous can be faced without any risk for the driver and for the researchers as well.
● A well-designed testing scenario allows a very good repeatability of the driving environment and control of all variables (traffic, course, road and weather condition, etc.).
● The situations through which the driver goes can be adapted to the driver behaviour itself.
● All testing parameters can be easily recorded and stored for successive elaboration.
● Experimentation can be speeded up.
On the other hand, the driving scenario must be carefully designed in order to obtain a sufficient representativeness of the results, and often a validation activity must be carried out, for instance by carrying out staged tests in controlled environments or by monitoring real-life driving. Moreover, not all the drivers are able to drive comfortably in a driving simulator. Although some of the testing activities regarding ADAS development can be carried out using static simulators, the use of an advanced immersive driving simulator allows to have all the needed functionalities together with a sufficiently realistic testing condition.
In the present chapter, a simulator experimental study is presented, aimed at understanding drivers behaviour when a sudden hazardous situation with pedestrians is presented; for such aim, 69 young drivers were submitted to different virtual driving scenarios. The experimentation, far to be definitive, will anyway provide useful information for setting up a driver model as well as for determining HMI requirements.
Definition of a reference accident scenario
Among road users pedestrians represent one of the weaker categories, and the percentage of accidents involving pedestrians is relatively high. According to WHO [19], in 2013, 22% of about 1.25 million worldwide road traffic deaths were pedestrians. In the USA, during 2012, 4743 pedestrians were killed (total casualties 33,561) and 76,000 were injured (total 2,362,000) [20]. It can be seen that the percentage of deaths with respect to injuries among pedestrians (6.2%) is much higher than the general one (1.4%), thus confirming the high level of danger. Pedestrian safety is expected to be highly boosted by the adoption of assistance systems as pedestrian detection system (PDS) and V2I communications, and for this reason it was chosen to study the drivers behaviour in a situation with a high risk of being involved in an accident with a pedestrian.
Accident reconstruction is a powerful tool to explain the reasons of an accident and identify the main contributing factors. Thus, 26 accidents involving pedestrians actually happened in Austria were analysed using the CEDATU (Central Database for In-depth Accident Study) database [21, 22], by also using multi-body simulations (PC-Crash, DSD, 2015).
Following the indications collected during the preceding phase, a reference accident scenario was defined having, among others, the following features: low-density population urban environment, late evening (heavy darkness) with scarce electric lighting, good weather and road conditions, non-intersection, and pedestrian not using a crosswalk and walking without running from left to right; moreover, a car is coming from the opposite direction obstructing the visual.
Set-up of the simulation scenario
Sixty-nine young drivers were employed for the driving simulator testing, enrolled on a voluntary basis mainly among the students of the School of Engineering of the University of Florence. Each subject drove the test scenario once. Sixty-one tests were considered valid, whereas the remaining were discarded because of excessive simulator sickness or weird behaviour of drivers and simulator software; the main characteristics of the drivers of valid tests (18 female, 43 male) are shown in Table 3. Age varied between 19 and 36 years and also driving experience was very different, ranging from few hundreds of kilometre per year to 50,000. Nineteen tests were actually used to tune the simulation scenario (set-up tests) and, in particular, to synchronise the behaviour of the other road users at the emergency situation. The remaining 42 drivers were used for the actual experimentation.
For the experimentation, the driving simulator available at LaSIS (Laboratory for Road Safety and Accident Reconstruction, University of Florence, Italy) was used. It consists of a full-scale dynamic simulator (Figure 2) provided by AutoSIM (Norway, model AS 1200); the complete vehicle cabin and the 200 degrees wide cylindrical screen allow an immersive driving experience.

FIGURE 2.
View of the simulator in use at LaSIS.
Following the indications obtained from the statistical analysis and the thorough reconstruction of typical road accidents, a generic scenario was defined, adapting one of the terrains available in the simulator database. In particular an environment with little population was chosen, in which the emergency situation described above was inserted (Figure 3). The driver reaches the point after having driven for about 5 minutes, encountering some vehicular traffic and pedestrians. Since the terrain contains several intersections and roundabouts, to be sure that the drivers reach the point of interest in a given time, indications by means of direction arrows were projected on the screen. The entire test was driven in night time conditions.
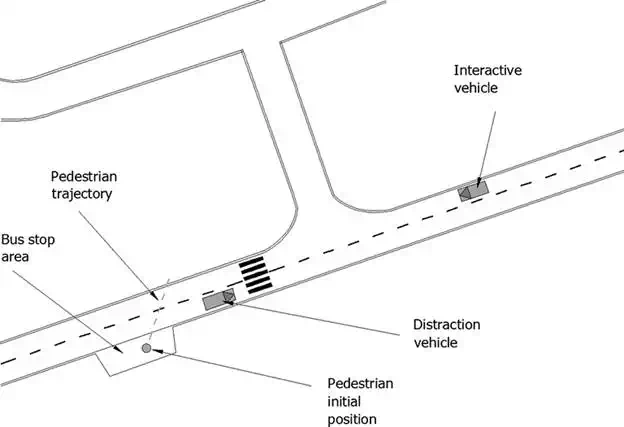
FIGURE 3.
Map of the emergency situation area.
Before driving the test scenario, the subjects faced a training scenario in which, during about 10 minutes, they could get acquainted with the vehicle cabin and try the most common manoeuvres; the subjects began the drive under daylight and ended with dark condition in order to get gradually accustomed with night driving. In some of the tests, the presence of an ADAS was simulated, consisting in a pedestrian detection system. Those drivers who were going to drive in the scenario with the ADAS system also experienced it in the training scenario. Before and after the test, each subject was submitted a questionnaire in order to collect personal and driving information and record their impressions. Before the test, the subjects were informed about the aim of the test and were instructed on the basic functions of simulator and cabin; they were invited to drive in a normal way, respecting the normal traffic rules. No hints were given about the emergency situation they were going to meet. The emergency situation was designed as follows (Figure 3): when the interactive vehicle is at a given distance from the emergency area, a vehicle starts travelling in the opposite direction, interfering with the visual. When the interactive vehicle is at a distance that corresponds to a time to collision of about 4.5 s, a pedestrian starts walking from the opposite side of the road, heading along an oblique direction, with a constant speed of 1.67 m/s; in the first part of his path, the pedestrian is hidden by the distraction vehicle (Figure 4a).
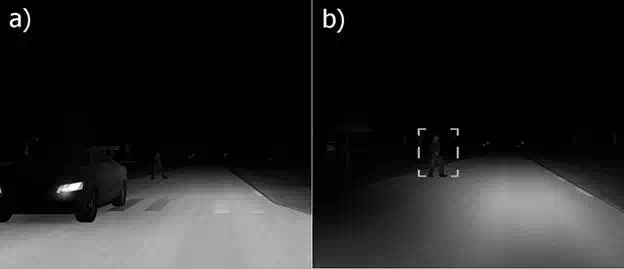
FIGURE 4.
Scene of the emergency situation as seen by the subject driver: in scenarios A, B and C (a) and in scenario D (b).
Four different scenarios were set, one without ADAS and three in which the drivers were helped by a simulated PDS assistance system, characterised by different alert modes:
● Scenario A: no ADAS was simulated (12 drivers);
● Scenario B: a sound alarm (consisting of beeps with increasing frequency) is issued after 0.5 s the pedestrian start (10 drivers);
● Scenario C: as scenario B except that the sound is emitted after 1.5 s (10 drivers);
● Scenario D: as scenario C (10 drivers) with the addition of a visual warning, consisting in a self-lighted rectangular frame around the pedestrian (Figure 4b). The aim was to provide additional information to the driver about the position of the hazardous situation, simulating the use of a head-up display.
Data analysis
To obtain the results, data from three sources were analysed:
● Disk recording of several parameter of the vehicle, at the rate of 20 S/s, including position, speed, acceleration, pedals use, gear, steering wheel position, vehicle position in the lane, etc.
● Visual recording of the entire simulation, as performed by the simulator software.
● Information filled in questionnaires by the subjects.
From such data, besides a qualitative description of the drivers behaviour, the following values were calculated:
● Time, speed and position when a given event occurred (as reactions, actions, etc.).
● Time to collision (ttc) following a given event; time to collision is defined as the time needed to reach a given position (for instance an obstacle) if the speed is maintained constant; such value provides indications of the closeness of a danger situation, allowing for speed and distance; ttc of the vehicle relative to the pedestrian was calculated allowing for its actual position, since it can walk.
● Time between braking onset and maximum braking activation; it provides indications on how fast maximum braking action is obtained.
● Actual degree of emergency (ADE) shown in Eq. (1), combining speed (V), time to collision (ttc) and reaction time (tR); it represents the constant deceleration that should be applied to stop just in front of the obstacle and is expressed as follows [15]:
|
● ADE=V2⋅(ttc−tR) |
● (1) |
● Options
● In the present study, when ttc refers to the moment of braking onset, tR is put equal to zero.
Results
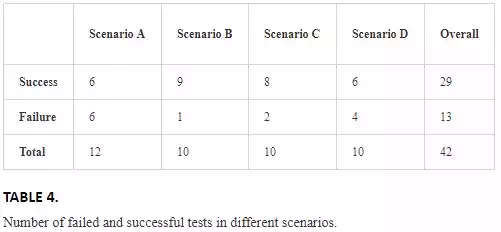
All of the subjects had some reaction when approaching the pedestrian, but only 29 drivers out of 42 succeeded in carrying out a successful manoeuvre to avoid the collision. Usually, the drivers reacted by releasing the accelerator pedal and pressing the brake pedal; only two out of 29 successful drivers, after a short use of brakes, steered and avoided the obstacle (tests 31 and 34). None of the drivers chose to steer instead of braking. Thirteen drivers out of 42 hit the pedestrian (see Table 4): 50% in scenario A (without ADAS) and 23% in all the scenarios with ADAS. Of these only 4 out of 13 tried, while braking, to steer.
Tests without ADAS had higher speed at collision than those with ADAS, being in average 33.1 km/h (SD = 11.9 km/h) versus 22.4 km/h (SD = 9.4 km/h), with some statistical significance (P-value = 0.06 following the t-test [23]). As regards the functions of the simulated ADAS device, 4 out of 30 declared they did not hear the acoustic alarm, whereas 10 out of 10 saw the visual one.
TIME OF ACTION AND REACTION
Time of action was determined by analysing the signal regarding pedals (brake and accelerator) and steering wheel. Every effort was put to identify the first action caused by the perception of a hazard. Approaching the obstacle an action on the brake was always detected; in the cases of scenarios with ADAS, sometimes the action on the accelerator was detected before the alarm was issued, mainly because the driver was prudently reducing the speed approaching an intersection with some traffic, so that the first action was considered braking; this happened 11 times out of 30.
Since the moment when the driver saw the pedestrian cannot be determined, it was not possible to obtain a reaction time following such event. In the cases of scenarios with ADAS, reaction time was here defined as the time interval between the alarm and the first successive action (on accelerator or brake); its mean value resulted to be 0.88 s.
An indication about the degree of emergency perceived by the driver can be the time difference between the first (releasing the accelerator) and the second action (pressing the brake pedal) tA2 − tA1; the comparison between different scenarios, as well as the overall scenarios with ADAS, is shown in Figure 5. The t-test showed that there is no significant difference among the scenarios with ADAS (P-value > 0.5), whereas these last are significantly different from scenario A (no ADAS, P-value < 0.05).

FIGURE 5.
Mean values of tA2 − tA1 ± SD.
TIME TO COLLISION
Time to collision [15] is the time at the end of which a collision will occur if speed does not change; in this study it was evaluated at the moment of the first action (release of accelerator) and the second action (braking). In Figures 6 and 7, mean values of both parameters are shown together with their dispersion. Scenario A yielded a significantly lower value for ttcA1 (1.46 s vs. 2.52 s, P-value < 0.0001) as well for ttcA2 (1.34 s vs. 1.92 s, P-value < 0.01) in comparison to all the scenarios with ADAS.
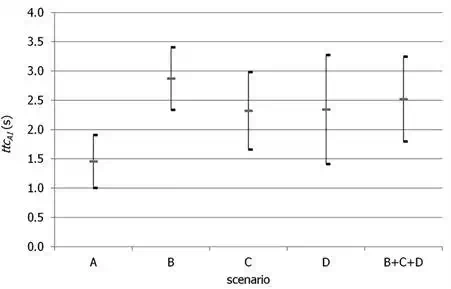
FIGURE 6.
Mean values of ttcA1 ± SD.
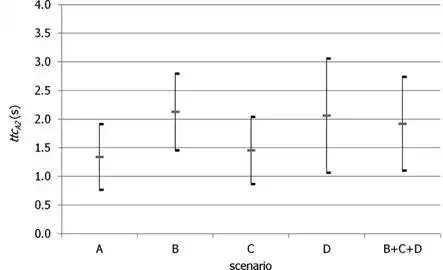
FIGURE 7.
Mean values of ttcA2 ± SD.
Among the scenarios with ADAS, as expected, there were significantly higher values for scenario B as compared to scenario C as regards ttcA1 (2.87 vs. 2.32 s, P-value = 0.06) and above all as regards ttcA2(2.13 vs. 1.46 s, P-value = 0.03). No significant difference was found between scenarios C and D.
BRAKING
Braking represented, for 27 drivers out of 29, the first active actions attempted by successful drivers (as said, only two avoided the obstacle by steering only) since releasing the accelerator pedal, in itself, has a little effect on speed reduction. Braking is one of the actions that showed differences throughout the experimentation. In Figure 8, for instance, some typical modes of actions on the brake pedal are shown; they are related to the emergency braking approaching the pedestrian during four tests, two successful and two failed.
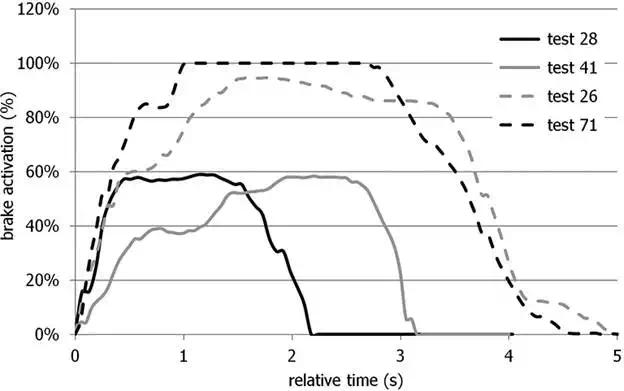
FIGURE 8.
Typical emergency brake pedal activation; tests 28 and 41 were successful, and tests 26 and 71 were failed.
The main difference lies in the different time that the driver used to reach the maximum pedal activation. In order to characterise such difference, the parameter tmax tA2 is introduced, as the time difference between the beginning of the braking activation and the instant when the maximum action is reached. Such value could not be calculated for all the tests since in some failed tests the collision happened before the braking action reached a stabilised level. As shown in Figure 9, where tmax tA2 is plotted as a function of time to collision, a clear trend is visible, indicating that when ttc decreases, the action on the brake tends to be faster.
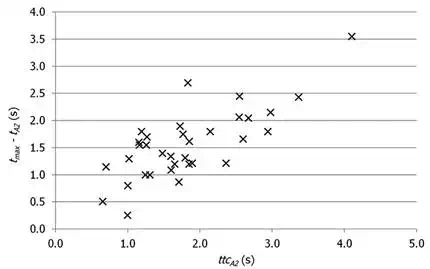
FIGURE 9.
Trend of tmax − tA2 as a function of time to collision.
As shown in Figure 10, tmax tA2 is also influenced by the presence of ADAS; scenarios with ADAS yielded significantly higher values than scenarios without ADAS (in average 2.03 s vs. 1.09 s, P-value < 0.001). As a consequence, part of the advantage afforded by ADAS devices (seen above, for instance, in terms of time to collision) is wasted because of a slower action on the brake pedal; trials that ended with a collision (indicated by a cross) are in some cases characterised by relatively high tmax tA2, indicating that a different braking approach could sometimes help avoiding the collision.
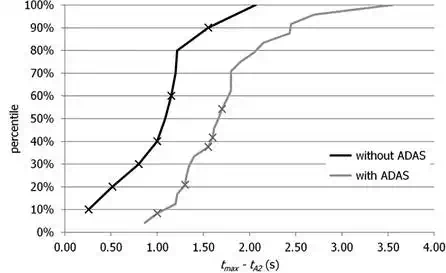
FIGURE 10.
Cumulated distribution for tmax − tA2 in tests with and without ADAS; the cross indicates a failed test.
ACTUAL DEGREE OF EMERGENCY
The parameter ADE introduced above can provide indications on the degree of emergency (meant as the urgency to react) of a given hazardous situation, but also indicates if a manoeuvre based on braking only can be successful, since the deceleration that a vehicle can experience is limited by the friction available.
In Figure 11, the cumulated distributions of actual degree of emergency corresponding to the action on the brake are shown, for failed and successful trials. A statistically relevant difference was identified between the two samples (in average 8.78 m/s2 for the failed tests vs. 3.89 m/s2 for the successful tests, P-value < 0.001). It is evident that it is impossible to stop before the collision when having ADE values near or greater than the maximum possible deceleration. Actually, the maximum value of ADEA2 that allowed a successful manoeuvre only acting on brakes was equal to 5.89 m/s2; the cases with higher ADE (tests 31 and 34, highlighted in Figure 11) were successful only because a steering manoeuvre was performed.
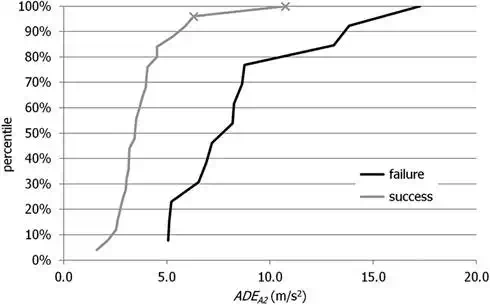
FIGURE 11.
Cumulated distribution for ADEA2 in failed and successful tests. The cross indicates trials in which the driver avoided the obstacle by steering instead of braking (tests 31 and 34).
Conclusion
The effect of the presence of the ADAS was relevant since, for instance, it was capable to halve the percentage of collisions. Similarly, some of the other parameters that were examined showed clear advantages of using such device, as ttCA1, ttCA2, actual degree of emergency and speed at collision. Parameters as tA2 − tA1 and tmax − tA2, instead, showed that the presence of the ADAS could not prevent a slower execution of the required actions, perhaps caused by the anticipated perception of danger, so that sometimes it seemed that the driver was not capable of fully exploiting the advantages allowed by ADAS. In such cases, the use of further automation as autonomous braking or emergency brake assist (helping applying and maintaining the correct pressure on the brakes, already used by several manufacturers) will certainly help.
As regards the comparison between the different ADAS modes (scenarios B, C and D), the conclusions are less straightforward. Scenarios B and C have the same alert mode (a beep with increasing frequency), but in the latter it starts one second later. Consequently, in scenario C, time to collision is significantly lower, as well as tmax − tA2, but no significant difference was identified as regards the other parameters, though always better. The advantage of an early alert seems, as expected, evident, and the risk of increasing the frequency of false positive in the attempt of anticipating the issue of the alarm must be carefully evaluated. As regards scenario D, in which a luminous rectangle framing the pedestrian was added to the same configuration of scenario C, no significant difference was noted, though all the drivers declared to have seen it but not everyone remembered to have heard the acoustic signal. Further experimentation and deeper comprehension is certainly necessary.
