Preparation and characterisation of cellulose-shellac biocomposites
The rising concern of environmental issues and the need for more versatile polymer-based materials has led to increasing interest in polymer composites with natural fillers made from renewable sources. The use of polymers and solid fillers combines the main properties of the two solid phases. The most widely known and used natural fillers are wood flour and fibres. Wood flour and fibres are interesting because of their low cost, good specific strength, low density per unit volume, along with their renewable and degradable features. The drawbacks of natural organic fillers include poor adhesion between the filler and the polymer matrix, and poor thermal and water resistance.
Numerous combinations of biocomposites can be found in the literature, including synthetic fibres reinforcing a biopolymer matrix, or, conversely, natural fibres reinforcing a synthetic polymer matrix, and hybrid composites containing both natural and synthetic fibres (Nickel et al. 1998; Biagiotti et al. 2004). Biocomposites are produced by mixing bio-based resins derived from natural oils with natural fibres. For short-term applications with a controlled end of life, biocomposites are ideal candidates. Thus, many papers have been published dealing with new, low-cost composites for many high-volume applications (Thomas and Pothan 2008). The most well-known and widely used renewable biodegradable polymers are those from polysaccharides, the principals of which are starch and cellulose. Biopolymers also include polymers from natural monomers (e.g., polylactic acid) and polymer from microbial fermentation, such as polyhydroxybutyrate. In addition, of particular interest are plant oils such as corn, olive, palm, canola, soy, and linseed oil, to name a few (Narine and Kong 2005). They mostly consist of a triglyceride molecule and a free fatty acid. Unsaturated fatty acid presents one or more double bonds, on which functional moieties can be added. A common example is soybean oil and its derivate, acrylated epoxidized soybean oil monomer (AESO) (Williams and Wool 2000).
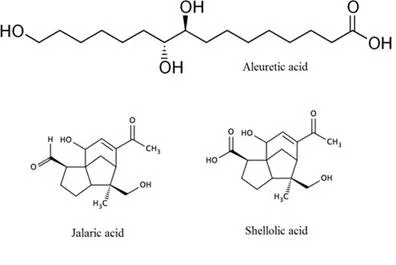
Fig. 1. Chemical components and the simplified structure of shellac resin
Shellac is derived from the secretion of a multitude of insects (e.g., Laccifer lacca, Kerria lacca) that are cultivated primarily in India and Thailand. It consists of a complex mixture of several polar and non-polar components (Schaeffer and Gardner 1938). The main acids, aleuritic acid and jalaric acid (Fig. 1), are connected by lactide and ester linkages. A hydrogen-bonding network ensures the cohesion of the structure and gives shellac with a resinous character. Shellac can be fractioned into three main phases, namely, hard resin (70%), soft resin (20% to 25%), and wax (5% to 10%). In its refined form, shellac is a polyester type of resin consisting of inter- and intra-esters of polyhydroxycarboxylic acids. It is insoluble in water, hydrocarbon solvents, and esters but dissolves readily in alcohol, alkali solutions, organic acids, and ketones. In addition, dewaxed shellac melts starting from 75 to 80 °C (Sharma et al. 1983).
Shellac is traditionally used as a coating material. Hydroxyl acids and polar groups present at the surface of the shellac molecules have the ability to orient themselves, which results in strong adhesion to many smooth surfaces. Shellac provides glossy surfaces with good hardness and UV resistance. However, shellac films present a relatively low moisture and oxygen permeability. These properties are often discussed in view of food protection applications (Hagenmaier and Shaw 1991; Thea et al. 2008; Chauhan et al. 2011). Furthermore, substantial literature can be found on the influence of additives and plasticizer (i.e., gelatin, starch, and coconut oil) on film performance and the ability to process (Byun et al. 2012; Soradech et al. 2013; Poovarodom and Permyanwattana 2015). Polyethylene glycol (PEG) can improve the interfacial interactions between resin and cellulose; the C–O–C and the O–H of the PEG can form hydrogen bonding or dipolar interactions between the matrix and the reinforcing material (Qu et al. 2010). PEG makes the resin compatible and acts as a plasticizer, reducing the brittleness of the resin. In general, the lower molecular weight results in the greater plasticizing effect (Martin and Averous 2001).
Unlike film research, there have been relatively few papers on composite materials based on shellac. There are, nevertheless, four published studies dealing with jute fibres and shellac that are promising. In the first two studies, jute fibres were coated with shellac so that the fibre/matrix bonding at the interface was higher (Ray et al. 2006; Shikamoto et al. 2008). In the third study, jute cloth was strengthened by impregnation with shellac (Khan et al. 2015). Both studies showed good adhesion between shellac and natural fibres. In the final study, biocomposite based on jute fibre reinforced with aleuritic acid (shellac waste) exhibited good mechanical properties (Biswas and Ray 2013).
In terms of application, one of the most promising uses of biocomposites is in packaging. The properties and biocompatibility of potential biomaterials for food packaging have been examined thoroughly (Petersen et al. 1999; Siracusa et al. 2008). Moreover, the handbook of food packaging (Paine and Paine 1992) defines all required characteristics. Shellac and cellulose are fully biocompatible and interesting candidates for composite materials, though barrier properties against moisture, oxygen, and gas have yet to be studied.
The purpose of this study was to produce and characterize fully bio-based composites. Cellulose fibres and cellulose ester particles were used as reinforcements in bio-based polymer matrix, namely shellac. The influence of the additive concentration on the mechanical properties of biocomposite was evaluated. Comparative studies on the physical and mechanical properties evaluated in terms of the influence of the polarity of cellulose on the adhesion between the reinforcement and the polymer matrix.
EXPERIMENTAL
Materials
Cellulose pulp was acquired from Stora Enso Fabriker, Skutskär, Sweden. The first set of samples was manufactured with astra shellac (Dictum, Metten, Germany). Later on, tests were carried out with wax-free shellac purchased from Fluka Analytical (Munich, Germany). Cellulose acetate butyrate (Mn ≈ 12 000) was purchased from Sigma Aldrich (Munich, Germany). Polyethylene glycol (DP ≈ 400) and ethanol (≥ 99.5%) were purchased from Sigma Aldrich (Munich, Germany). Wax for chromatography was used to grease the mould.
Refining of Pulp Fibres
Pulp was produced from a controlled mixture of pine and spruce (70:30). Low consistency (LC) refining of wood pulp was carried out at the laboratory with a ProLab refiner (Valmet Technologies Inc., Valkeakoski, Finland). Pine pulp was refined at 200 kWh in a refiner with disk fillings. Pine pulp was physically refined in water. The water was then removed by filtering on a Buchner funnel, and the pulp was washed with ethanol. Refined wood pulp was stored in ethanol.
Dry Content of Refined Cellulose Pulp
Ethanol was removed by filtration. Ten grams of cellulose pulp soaked in 95% ethanol was filtered on a Buchner funnel, and the filtration time was adjusted with respect to the moisture content expected. The calibration curve (Fig. 2) was prepared by measuring the dry content of samples at different filtration times. For each time, three samples of cellulose pulp were analysed with a moisture analyser. The measurement error was equal to ± 1% to 2%.
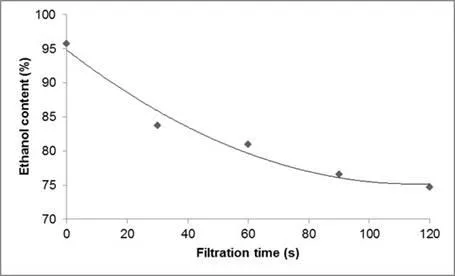
Fig. 2. Calibration curve versus ethanol content according to filtration time
Biocomposites Manufacturing Process
Shellac and cellulose at a ratio of 2:1, in addition to additives, were placed in a beaker and mixed for 20 min at variable temperatures. The mixture was then spread in a greased hot mould and left for 10 min. The mould was placed under a press at room temperature for 5 min. Cooling lasted for at least an additional 5 min and as long as overnight, depending on the chemical composition of samples. Subsequently, composite samples were removed from the mould. The biocomposite composed of cellulose fibres and shellac was named CF-SHE, and biocomposite prepared from cellulose particles and shellac was named CP-SHE. The process is depicted in Fig. 3.
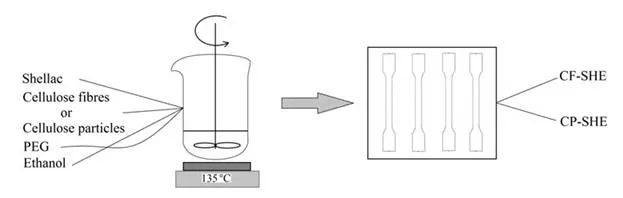
Fig. 3. Illustration of biocomposite fabrication
To optimize the manufacturing procedure, experimental parameters of the melting process were studied. The temperature was varied from 100 to 150 °C; above 135 °C, the mixture boiled. The formation of bubbles led to a porous material. Fast evaporation of ethanol hindered good homogenization of the matrix and the reinforcement, resulting in samples that were more brittle. At lower temperatures (below 110 °C), the process was longer and the viscosity higher, which made it difficult to spread the matrix into the mould. The optimal viscosity was obtained at 130 °C with a total processing time of 30 min (20 min before spreading and 10 min in the mould).
When wood pulp was saturated in ethanol (cellulose dry content of 5%) it could not be processed. Due to the solubility of shellac in ethanol, a sticky gum was obtained, and all mechanical properties were lost. Consequently, cellulose pulp was filtered at different times so that samples with different ethanol concentrations were obtained. If the cellulose dry content (CDC) was higher than 25%, the cellulose pulp could not be evenly dispersed in the matrix. This uneven dispersion caused agglomerates, thus displaying anisotropic mechanical properties. Adding a minimum of 75% ethanol made the mixture less viscous and easier to process. Three cellulose dry contents of 15%, 20%, and 25% were more deeply examined.
Determination of Biocomposite Structure using IR Spectroscopy (ATR)
Samples were analysed by attenuated total reflectance (ATR) in the frequency range of 4000 to 400 cm-1 on a Thermo Scientific Nicolet iS50 Spectrometer (Waltham, MA, USA). A total of 64 scans were taken with a resolution of 4 cm-1. The spectra were recorded in the transmission mode and converted into absorption for display. Omnic software (Thermo Scientific, Waltham, MA, USA) was used to find peak positions and process the spectral data.
Contact Angle of Biocomposites
Static contact angles were measured with a KSV CAM 200 optical goniometer (KSV Instruments Ltd, Helsinki, Finland). The average value of five replications was recorded. A droplet of 4 μL was placed on the solid surface, and the image of the drop was recorded over 60 s with a picture every 0.01 s during the first 5 s, and subsequently every 0.4 s. The static contact angle, defined by the intersection of the three phase boundaries between liquid (l), solid (s), and vapour (v), was then determined by fitting the Young-Laplace equation (Eq. 1) around the droplet, although other fitting methods such as circle and polynomial could also be used:
γsv = γsl + γlv cos θ (1)
Field Emission Scanning Electron Microscopy (FE-SEM)
The morphology of sections resulting from tensile strength testing was examined using a Leo Gemini 1530 field emission scanning electron microscope (Oberkochen, Germany) with an In-Lens detector. Samples were coated with carbon in a Temcarb TB500 sputter coater (Emscope Laboratories, Ashford, UK). The optimum accelerating voltage was 2.70 kV, and the magnifications were x 1500, 10000, 25000, and 50000.
Mechanical Characterization of Biocomposites
Mechanical properties of composite samples were measured with an Instron 8872 instrument (Grove City, USA) using a continuous stiffness measurement in a force-controlled mode (10 mm/min). The tensile strengths of three to five samples with the same composition were tested. The calculated stress-strain curve revealed the following characteristic values: Young’s modulus (E), yield strength, and maximal elongation.
RESULTS AND DISCUSSION
ATR-IR Analysis
The attenuated total reflection infrared spectroscopy (ATR-IR) spectra of shellac and composite samples with different CDC are represented in Fig. 4. Shellac was characterized by the following groups: alcohol groups with a wide peak at 3400 cm-1 (aliphatic –OH stretch); C–H stretch at 2850 and 2900 cm-1 (Socrates 2001) and at 1700 cm-1 (C–O–C aliphatic aldehyde/ketone, carboxylic acid stretch); double bonds appearing at 1650 cm-1 (stretch); and ester groups with a peak at 1250 cm-1 (C–O–C asymmetric aliphatic ester stretch). The presence of cellulose was revealed by the peak at 800 cm-1, and the intensification of two groups of peaks, the first near 1000, 1050, 1100 cm-1, and the second at 1750 cm-1, that respectively corresponded to the C–O stretch band of aliphatic primary, secondary alcohols, and asymmetric ester. A higher content of cellulose fibres was not necessarily indicated by the higher absorbances at the 800 cm-1 and 1000 cm-1 peaks. Such intensities were sensitive to where ATR-detector was put on the cellulose samples, which is presumably why a less cellulose concentrated sample exhibited higher intensity. In addition, the wide peak at 3400 cm-1 was shifted to the left by increasing cellulose fibre content, which was characteristic of the formation of hydrogen bonds and hence interactions between cellulose chains, but also between the fibres and the matrix (Ray et al. 2006).
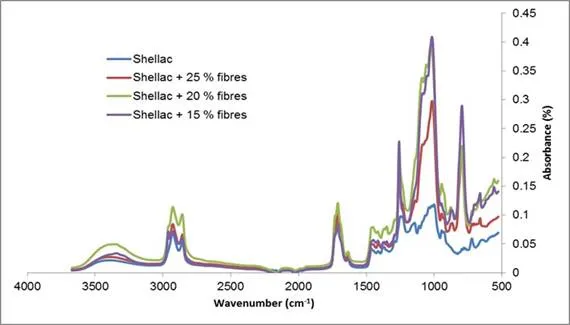
Fig. 4. ATR spectrum of pure shellac and shellac composite (CF-SHE) with different cellulose fibre contents
Tensile Properties
The ability to resist breakage under tensile stress is one of the most important and widely measured properties of materials. The elongation at break of an engineering material is the percentage increase in length that occurs before it breaks under tension. The high value for elongation at break at approximately 30% to 35% was for cellulose fibres with 15% and 20% dry content (Fig. 5). However, ethanol assisted in the dispersal of cellulose fibres into the matrix. Consequently, at high dry content, the breaking point often occurred earlier (10 to 20% of elongation) because of irregularities weakening the sample. Generally, increasing the fibre content in the matrix leads to a lower elongation at break of a composite (Ishak et al. 2010). In addition, as the fibre content increased, the shellac was insufficient to wet the fibre entirely and led to poor interfacial bonding between the fibre and the matrix. When force was applied, the composite had the tendency to fail rather than elongate (Bismarck et al. 2005). Unlike strain, the maximal stress depended on cellulose dry content. At 15% CDC, the maximal stress was less than 500 kPa, while it was concentrated at approximately 2200 ± 400 kPa and 1400 ± 400 kPa for 20% and 25% CDC, respectively.
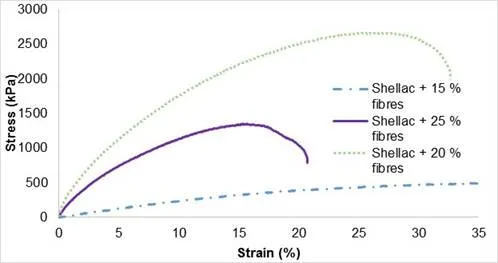
Fig. 5. The stress-strain curves for shellac composite (CF-SHE) with different cellulose fibre contents
The influence of cellulose dry content of pulp on the Young’s modulus is illustrated in Table 1.With an excess of ethanol (> 15%), the Young’s modulus of specimens noticeably dropped. Maximum stress could be reached at approximately 20% of cellulose dry content. Two more samples at intermediate dry content were analysed and confirmed the tendency despite error bars. In general, the tensile strength of the natural fibre reinforced polymer composites increase with fibre content, up to an optimum value, after that point the value dropped. It is obvious that the strength and stiffness of the natural fibre polymer composites was strongly dependent on fibre loading. The tensile strength and modulus can be expected to increase with increasing fibre weight ratio up to a certain amount (Ku et al. 2011). If the fibre weight ratio increases below optimum value, the load is distributed to more fibres, assuming that the fibres are well bonded with resin matrix, resulting in better tensile properties. Further increment in fibre weight ratio has resulted in decreased tensile strength as shown in the Table 1. Consequently, the following experiments were carried out with a dry content of 20%.
Table 1. Evolution of Contact Angle and Young’s Modulus with Dry Fibre Content (CF-SHE)
In addition, contact angle analysis gave evidence of two surface behaviours. Contact angles slightly decreased with high ethanol content (Table 1). The contact angle increased slightly from 75° to 80° when the cellulose dry content increased to 25% w/w. Contact angles lower than 90° indicated hydrophilic character and good wettability of the surface. The increase in wettability was in accordance with the higher total surface free energy, the lower dispersive force, and the higher polarity force with the increase in cellulose content. No adsorption was observed.
SEM Analysis
Scanning electron microscopy (SEM) analyses provided evidence of the relation between the morphology and the mechanical behaviour of the biocomposites. Biocomposite CF-SHE with a CDC of 25% had two phases (Fig. 6).
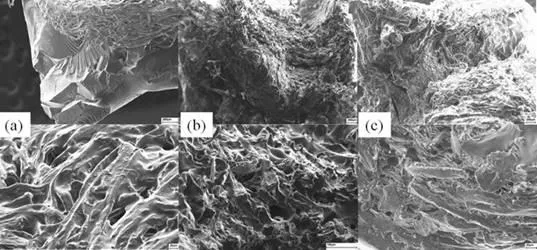
Fig. 6. Scanning electron microscopy images of the shellac composite CF-SHE with (a) 25%, (b) 20%, and (c) 15% cellulose fibres
Fibres were not dispersed well in the matrix, but formed aggregates, while shellac formed a separate phase. Fibres, therefore, had no noticeable effect on the matrix. As a result, the mechanical behaviour of the sample was similar to that of pure shellac. Biocomposite with a CDC of 20% had much better dispersion of fibres in the matrix. Shellac appeared to be softer and covered the fibres. This structure suggested more influence of fibres on the mechanical behaviour of the composite. In fact, at this level of cellulose dry content, the stress and the strain were higher than at 25%. However, holes that formed due to air bubbling during the curing process were observed. Improved properties could be reached with better curing conditions. Biocomposite CF-SHE with a cellulose dry content of 15% also had fibres well dispersed and coated by the matrix material. However, the stresses caused by mechanical testing broke the matrix and pulled out the fibres. As a result, single fibres and voids appeared, demonstrating that ethanol in high levels weakened the matrix material by dissolution and led to lower stress resistance.
The Effect of Plasticizer on the Composite Mechanical Properties
Samples of biocomposite CF-SHE with different ratios of matrix/reinforcement were synthesized and their mechanical properties were compared. The cellulose pulp used had a dry content of 20%.
Figure 7 presents the mechanical behaviour of biocomposite CF-SHE at different shellac/pulp ratios. The amount of cellulose pulp had an important impact on the mechanical performance. Young’s modulus increased from 284 ± 80 kPa to 1731 ± 300 kPa. In general, the Young’s modulus of the composite material increased with increasing fibre content (Ku et al. 2011). Nevertheless, processing the material with high cellulose concentration was more challenging, and the composites obtained were not homogeneous. Consequently, the maximal elongation was much lower.
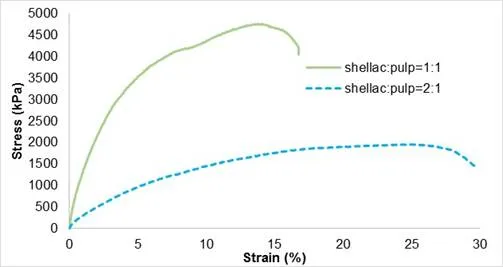
Fig. 7. Stress-strain curves of biocomposite CF-SHE regarding cellulose fibre and matrix ratio
PEG acted as a plasticizer and helped the process of material preparation. To determine the influence of plasticizer on the material performance, samples were prepared with different concentrations of PEG ranging from 2 wt.% to 8 wt.%. The concentration of PEG had no impact on the contact angle, which was 80° ± 4°, and the IR spectrum did not change. However, adding plasticizer had an important impact on the mechanical behaviour of composite material. The stress-strain curves of biocomposite CF-SHE at different PEG concentrations are shown in Fig. 8. Increasing the amount of low molecular PEG caused a lower plasticization of fibre-based composite. The reason may be that lower molecular PEG was interfering in interfacial adhesiveness between cellulose and shellac, which caused cellulose slippage from the matrix even in low stress. Similar trends were observed for cellulose fibres and cellulose particles.
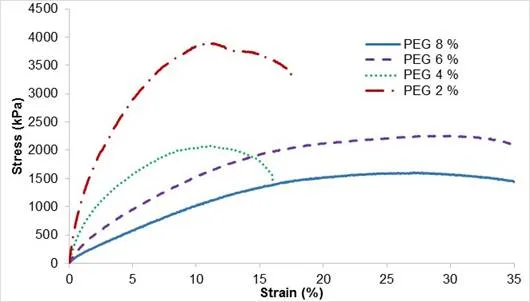
Fig. 8. Stress-strain curves of biocomposite CF-SHE regarding PEG content
A tendency similar to that observed with different ethanol contents was observed when changing the amount of PEG. When the concentration of PEG was lowered, the stress resistance was higher. The sample without plasticizer was more brittle, however, partly because of the increased difficulty in processing and manufacturing a homogeneous sample.
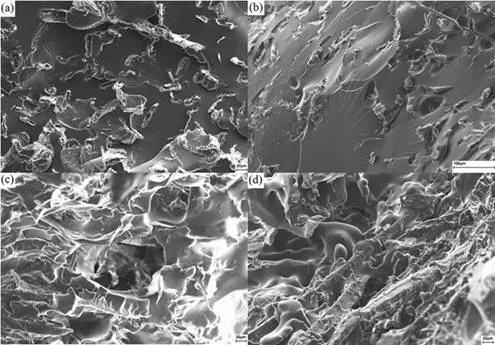
Fig. 9. Scanning electron microscopy images of the shellac composite CF-SHE with (a) 2%,
(b) 4%, (c) 6%, and (d) 8% PEG concentration
The Young’s modulus exponentially decreased. According to Limmatvapirat et al. (2004), the major part of shellac is composed of a hard resin that corresponds to a crystalline region formed through chain-to-chain ester bonds. The structure of the crystalline structure causes rigid and brittle characteristics of the shellac layer. As a small molecular weight compound, PEG 400 interfered with the shellac system, reducing the chain-to-chain ester bonds and thus increasing the membrane toughness or flexibility. Furthermore, PEG was able to attract water that amplified the plasticizing effect.
SEM images showed that adding PEG changed the morphology of the matrix (Fig. 9). When comparing images of samples with low PEG concentrations, the matrices of composite samples with higher PEG had more wrinkled surfaces. The wrinkled surfaces could indicate that there was a chemical incompatibility between the reinforcement and the shellac, explaining the lower stress resistance. However, the interface between the fibres and the matrix demonstrated that, at low concentration, fibres were each surrounded by a void, suggesting chemical incompatibility and no (or weak) interactions with the matrix. At higher concentration, there were no voids.
Influence of Cellulose Particle Content on Reinforcing Shellac Composite
Cellulose particles were added in varying concentrations to evaluate the influence of cellulose particle content on material properties. The cellulose particle content in the samples were 10 wt.%, 20 wt.%, and 30 wt.%. The ATR-IR spectrum of each sample type is represented in Fig. 10.
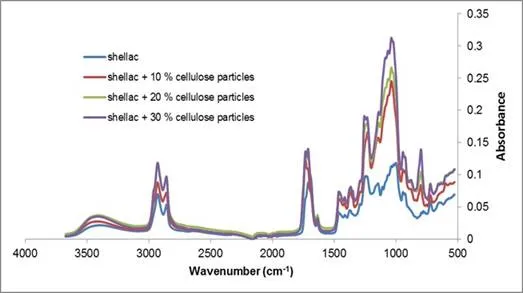
Fig. 10. The ATR spectrum of pure shellac and shellac composite CP-SHE with varying cellulose particle content
The presence of cellulose acetate butyrate was characterized by the appearance of a peak at 800 cm-1 and the intensification on the following peaks: 3400, 1050, and 1000 cm-1, corresponding to the introduction of OH groups; 2900, 2850, and 1700 cm-1, corresponding to asymmetric and symmetric methyl and methylene stretching groups, were present in the spectra of all of the fibre components, but most notably in the spectra for cellulose; and 1250 cm-1, corresponding to ester groups. The higher the cellulose particle content, the higher the absorbance. Nevertheless, the peaks at 800, 1000, 1050, and 1100 cm-1 were proportionally bigger for fibres of the reinforced composite CF-SHE than for particles of CP-SHE. Peaks at 1250, 1700, and 1750 cm-1 were smaller. This difference could be explained by the presence of acetate butyrate groups on cellulose, and thus the substitution of alcohol groups by ester groups. In addition, the wide peak at 3400 cm-1 for shellac was shifted to only 3300 cm-1 for the cellulose fibre composite, indicating that fibres formed more hydrogen bonds with the matrix than with particles. This observation agreed with Dong et al. (2006). Shellac, having plenty of –OH and –COOH groups in its structure, can take part in hydrogen bonding with the fibres.
The evolution of the mechanical behaviour according to cellulose concentration (10%, 20%, and 30%) is illustrated in Fig. 11, and the main values are indexed in Table 2. Stress resistance and the Young’s modulus were higher when the content of cellulose particles in biocomposite CP-SHE was also higher. Nonetheless, the elongation at break remained equivalent to 36%.
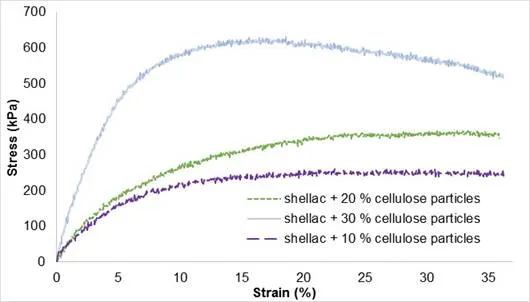
Fig. 11. Stress-strain curves of biocomposite CP-SHE regarding cellulose particle content
Table 2. Evolution of the Contact Angle and Young’s Modulus by Varying Cellulose Particle Content
The contact angle decreased when the concentration of cellulose particles increased. This behaviour was not expected, given that cellulose particles are hydrophobic, with a long lateral group (four carbons). A possible explanation for the decreasing contact angle is that molecular orientation occurred in the surface of the cellulose derivative against the hydrophilic shellac, which caused the surface of the biocomposite to become more hydrophilic.
The Influence of Plasticizer on Cellulose Particles-Shellac Composite Mechanical Properties
Polyethylene glycol acted as a plasticizer to facilitate the manufacturing process and increase the elasticity of the composite. After many trials, the composite (CP-SHE) prepared with plasticizer had satisfactory properties at two concentrations, 11 wt.% and 19 wt.% of PEG. The graph in Fig. 12 represents the evolution of mechanical behaviour regarding the concentration of PEG at 20% of cellulose particle content.
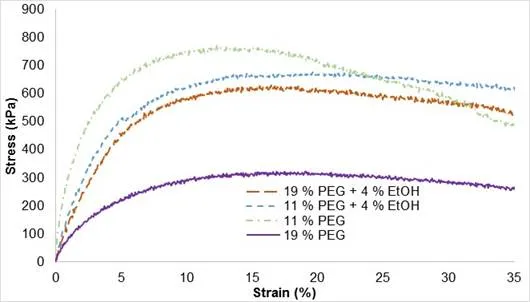
Fig. 12. Stress-strain curves of biocomposite CP-SHE regarding PEG content
When the PEG concentration increased, the stress resistance of the samples decreased. Different molecular weights of PEGs had different plasticization mechanisms. Results reported by Qussi and Suess (2006) showed that the addition of plasticizer caused a decrease in both the elastic modulus and glass transition temperature (Tg), and an increase in the elongation at break of free shellac films. The incorporation of different amounts of hydroxypropyl methylcellulose, methylcellulose, or carbomer 940 in free shellac films caused an increase in the flexibility, a decrease in Tg, and an increase in drug permeability of free shellac films, whereas the addition of polyvinyl alcohol caused a decrease in flexibility and drug permeability and an increase in Tg. Addition of ethyl cellulose resulted in a slight decrease of the elasticity and a small decrease in drug permeability. Ethyl cellulose did not, however, show a considerable effect on the Tg.
It is more challenging to understand the influence of ethanol. When 4% ethanol was added to the sample containing 11 wt.% PEG, stress resistance started dropping after 20%, and better mechanical properties were obtained when 4% ethanol was added to the sample containing 19 wt.% PEG. Scanning electron microscopy images (Fig. 13) showed that particles were porous and had a diameter varying from 40 µm to 400 µm. The comparison of images of samples in the presence and absence of ethanol corroborated the observed mechanical properties on samples containing 11 wt.% PEG.
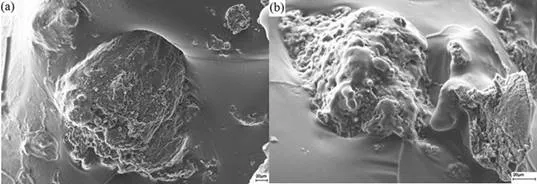
Fig. 13. Scanning electron microscopy images of the shellac composite CP-SHE with (a) 0%, and (b) 4% EtOH concentration
CONCLUSIONS