
GASCAP DRIVE
A typical gascap drive reservoir is shown in fig. 3.6. Under initial conditions the oil at the gas oil contact must be at saturation or bubble point pressure. The oil further downdip becomes progressively less saturated at the higher pressure and temperature. Generally this effect is relatively small and reservoirs can be described using uniform PVT properties, as will be assumed in this text.
There are exceptions, however, one of the most remarkable being the Brent field in the North Sea6 in which at the gas oil contact the oil has a saturation pressure of 5750 psi and a solution gas oil ratio of 2000 scf/stb, while at the oil water contact, some 500 feet deeper, the saturation pressure and solution gas oil ratio are 4000 psi and 1200 scf/stb, respectively. Such extremes are rarely encountered and in the case of the Brent field the anomaly is attributed to gravity segregation of the lighter hydrocarbon components.
For a reservoir in which gascap drive is the predominant mechanism it is still assumed that the natural water influx is negligible (We = 0) and, in the presence of so much high compressibility gas, that the effect of water and pore compressibilities is also negligible. Under these circumstances, the material balance equation, (3.7), can be written as
in which the right hand side contains the term describing the expansion of the oil plus originally dissolved gas, since the solution gas drive mechanism is still active in the oil column, together with the term for the expansion of the gascap gas. Equation (3.23) is rather cumbersome and does not provide any kind of clear picture of the principles involved in the gascap drive mechanism. A better understanding of the situation can be gained by using the technique of Havlena and Odeh, described in sec. 3.3, for which the material balance, equ. (3.12), can be reduced to the form
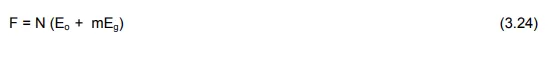
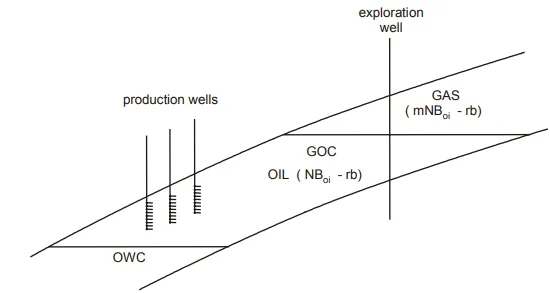
The way in which this equation can be used depends on the unknown quantities. For a gascap reservoir the least certain parameter in equ. (3.24) is very often m, the ratio of the initial hydrocarbon pore volume of the gascap to that of the oil column. For instance, in the reservoir depicted in fig. 3.6, the exploration well penetrated the gascap establishing the level of the gas oil contact.
Thereafter, no further wells penetrated the gascap since it is not the intention to produce this gas but rather to let it expand and displace oil towards the producing wells, which are spaced in rows further downdip. As. a result there is uncertainty about the position of the sealing fault and hence in the value of m.
The value of N, however, is fairly well defined from information obtained from the producing wells. Under these circumstances the best way to interpret equ. (3.24) is to plot F as a function of (Eo + mEg) for an assumed value of m. If the correct value has been chosen then the resulting plot should be a straight line passing through the origin with slope N, as shown in fig. 3.7. If the value of m selected is too small or too large, the plot will deviate above or below the line, respectively. In making this plot F can readily be calculated, at various times, as a function of the production terms Np and Rp, and the PVT parameters for the current pressure, the latter being also required to determine Eo and Eg. Alternatively, if N is unknown and m known with a greater degree of certainty, then N can be obtained as the slope of the straight line. One advantage of this particular interpretation is that the straight line must pass through the origin which therefore acts as a control point.