NATURAL FLOW PERFORMANCE
The most important parameters that are used to evaluate performance or behavior of petroleum fluids flowing from an upstream point (in reservoir) to a downstream point (at surface) are pressure and flowrate. According to basic fluid flow through reservoir, production rate is a function of flowing pressure at the bottomhole of the well for a specified reservoir pressure and the fluid and reservoir properties. The flowing bottomhole pressure required to lift the fluids up to the surface may be influenced by size of the tubing string, choke installed at downhole or surface and pressure loss along the pipeline. In oil and gas fields, the flowing systems may be divided into at least four components, as follow:
1. reservoir
2. wellbore
3. chokes and valves
4. surface flowline
Each individual component, through which reservoir fluids flow, has its own performance and, of course, affects each other. A good understanding of the flow performances is very important in production engineering. The combined performances are often used as a tool for optimizing well production and sizing equipment. Futhermore, engineering and economic judgments can depend on good information on the well and reasonable prediction of the future performances. As has been discussed in previous sections, hydrocarbon fluids produced can be either single phase (oil or gas) or two phases. Natural flow performance of oil, gas and the mixture will therefore be discussed separately. Some illustrative examples are given at the end of each subsection.
Inflow Performance
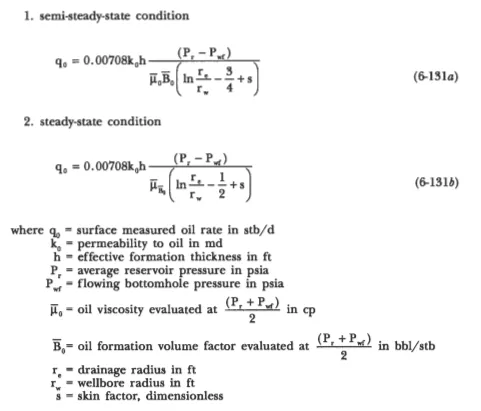
Inflow performance represents behavior of a reservoir in producing the oil through the well. For a heterogeneous reservoir, the inflow performance might differ from one well to another. The performance is commonly defined in term of a plot of surface production rate (stb/d) versus flowing bottomhole pressure (P, in psi) on Cartesian coordinate. This plot is defined as inflow performance relationship (IPR) curve and is very useful in estimating well capacity, designing tubing string and scheduling an artificial lift method. For single-phase liquid flow, radial flow equation can be written as (for oil
Assuming all parameters but P, are constants in the equations above, it is also clear that flowrate q, is linearly proportional to flowing pressure P,. Therefore, for laminar flow the plot q,, versus P, on a Cartesian coordinate must be linear. This is illustrated in Figure 6-76. Strictly speaking, it shows the behavior of single-phase liquid flowing over the range of P, In actual cases, however, straight line IPR may be shown by reservoirs producing at Pr and P, above the bubble point pressure P,, and by strong water-drive reservoirs. Productivity index, usually denoted by the symbol J, is commonly expressed in practice for well performance. It is mathematically defined as
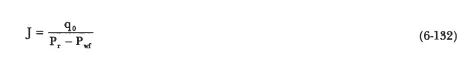
where J is in stb/d/psi. The term (P, - P,J is called pressure drawdown. Equation (6-131a) or (6-131b) can be rearranged to be used in estimating well productivity index. By knowing reservoir pressure P, it is possible to construct an oil IPR curve from a single flow test on a well. Or, due to the linearity of liquid IPR curves, by conducting a two-point flow test (two different flowrates while measuring the flowing bottomhole pressure) on a well, the static reservoir pressure can be determined.