Density-neutron log porosity
The combination of the density and neutron logs provides a good source of porosity data, especially in formations of complex lithology. Better estimates of porosity are possible with the combination than using either tool or sonic separately because inferences about lithology and fluid content can be made.
Density log
The density log measures the electron density of a formation. The logging device is a contact tool that emits gamma rays from a source. Emitted gamma rays collide with formation electrons and scatter. A detector, located a fixed distance from the tool source, counts the number of returning gamma rays. The number of returning gamma rays is an indicator of formation bulk density. The litho-density tool (LDT) also provides a photoelectron (Pe) cross section curve, an independent indicator of lithology.
Obtaining porosities from a density log
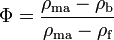
Formation bulk density is a function of matrix density, porosity, and fluids contained in the pore space. Formation bulk density measured by the log must be corrected for borehole irregularities. Convert bulk density to porosity using charts in a log interpretation chartbook, or calculate porosity from bulk density using this equation:
where:
· Φ = porosity
· ρma = matrix density (see table below)
· ρb = formation bulk density (log value)
· ρf = density of the fluid saturating the rock immediately surrounding the borehole—usually mud filtrate (use 1.0 for freshwater and 1.1 for saltwater mud)
Use the lithology matrix densities to determine porosity and average Pe to determine lithology listed in the table below.
Lithology | Density, g/cc | Average pe |
Sandstone | 2.65 | 1.8 |
Limestone | 2.71 | 4.8 |
Dolomite | 2.876 | 3.0 |
Anhydrite | 2.977 | 5.05 |
Salt | 2.032 | 4.6 |
Neutron log
The neutron log mainly measures hydrogen concentration in a formation. The logging device is a noncontact tool that emits neutrons from a source. Emitted neutrons collide with nuclei of the formation and lose some of their energy. Maximum energy loss occurs when emitted neutrons collide with hydrogen atoms because a neutron and a hydrogen atom have almost the same mass. Therefore, most neutron energy loss occurs in the part of the formation that has the highest hydrogen concentration.
Neutron energy loss can be related to porosity because in porous formations, hydrogen is concentrated in the fluid filling the pores. Reservoirs whose pores are gas filled may have a lower porosity than the same pores filled with oil or water because gas has a lower concentration of hydrogen atoms than either oil or water.
Obtaining porosities from a neutron log
Lithology, porosity, fluid type, and tool type affect neutron log response. When interpreting neutron logs, use the specific log for the specific tool, i.e., the charts in logging chart books that are specific to the sidewall neutron log (SNP) or the compensated neutron log (CNL).
To obtain porosity, read the value directly from the log. If the log is recorded in limestone units and the formation you wish to evaluate is sandstone or dolomite, then correct the log value by using the appropriate chart in a log interpretation chartbook.
Combination density–neutron logs
The density–neutron log is a combination log that simultaneously records neutron and density porosity. In some zones, porosities recorded on the logs differ for three reasons:
· The matrix density used by the logging program to calculate porosity is different from the actual formation matrix density.
· Gas is present in the formation pore space.
· Shale/clay is present in the formation.
Obtaining porosity from density–neutron logs
It is always best to read porosities directly from the logs where the lithologic units match the formation lithology. To obtain correct porosities from density–neutron logs when the two logs record different porosities for a zone, use one of the methods listed below.
Condition | Method |
Log matrix lithology is known and the two log curves separate (density porosity is less than neutron porosity) | If density porosity is less than neutron porosity, such as in a sandstone with shale/clay content, the density log provides a reasonable approximation of formation porosity. |
Log matrix lithology is known and there is crossover (density porosity is greater than neutron porosity) | Crossover (density porosity is greater than neutron porosity) is due to the presence of gas in the formation. Recompute density porosity using
Use gas density instead of water density. |
Chartbook is available | Plot the porosities on a density–neutron crossplot from a log interpretation chartbook. Use the appropriate crossplot for the log type (i.e., SNP, CNL) and mud type (fresh or salt). |
Chartbook is not available | Calculate porosity using the equation
where Φ is percent porosity, ΦN is neutron percent porosity, and ΦD is density percent porosity. |