 Equation 1
Using a Tray Dryer to Investigate Convective and Conductive Heat Transfer
Tray dryers are one type of batch dryer, which also include fluidized-bed dryers, freeze dryers and vacuum dryers. Tray dryers use convective heat transfer to flow heated air over solids to dry them. They are used by a variety of industries including for the production of pharmaceuticals and other chemicals1. Continuous dryers on the other hand are common to large volume product industries, such as the food industry1.
To begin the process in a typical tray dryer, the tray is filled evenly with a wet solid, such as sand, and loaded into the apparatus. The dryer’s adjustable fan and heater allow for continuous variations in air flow rate from the fan through the drying channel, and heat duty variations in 500 watt increments. As the dryer operates, water evaporates from the sand into the air. The drying rate is then calculated by weighing the initial solid/water mixture and subtracting the weight of the final dry solid and at various timed intervals.
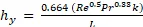
Heat transfer is driven by the temperature difference between the sand and the surrounding air. A simplified Newton’s Law of Heating (Equation 1) can be used to model the heat transfer between the heated air and sand-air interface to obtain an experimental heat transfer coefficient. Other heat duty terms are negligible compared to the term in Equation 1,
Equation 1
where q is the heat transferred, ṁ is the water evaporated in an allotted amount of time or rate of evaporation, ∆Hvap is the enthalpy of vaporization, hy is the heat transfer coefficient, Tair is the air temperature, and Ts is the sand’s surface temperature.
In order to obtain an experimental mass transfer coefficient, the transfer of water from sand to air will be modeled as mass transfer flowing across a true phase boundary. The drying rate equation (Equation 2) is this model.
 Equation 2
where ky is the mass transfer coefficient, C is the concentration of water, and A is the surface area of the boundary. Concentrations of water in the sand (Cs) and air (C∞) will be obtained by using a mass balance and psychrometric charts, respectively. These are used to solve for the drying rate.
Theoretical values can be compared to the experimental data by calculating heat and mass transfer coefficients. The theoretical heat (Equation 3) and mass (Equation 4) transfer coefficients are obtained from the properties of the substances involved from correlations.
 Equation 3
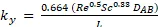 Equation 4
where Re is the Reynolds number, Pr is the Prandtl number, Sc is the Schmidt number, DAB is the diffusivity of water in air, L is the length, and k is thermal conductivity.
The experiment will consist of four runs, each testing a different combination of one of two fan and heat settings.
1. Tray Dryer Operation
1. Prepare the slurry by mixing 500 g of sand and 150 mL of water and load into the experimental tray for the unit. Spread the mixture evenly in the tray.
2. With the main unit off, place the tray in the drying chamber.
3. Turn on the main unit, then turn on the blower and heater.
4. Set the air velocity and temperature for each run. The three air velocities should range from 0.8 ft/s to 2.0 ft/s (one high, medium, and low) with a constant temperature around 195 ºF. The three temperatures should range from 130 - 200 ºF with a constant air velocity of 1.8 ft/s.
5. Take measurements every 5 min over the entire run, which should last 45 min. The data collected should include inlet air temperature, sand temperature, sand weight, outlet air temperature, outlet air flow rate, dry bulb temperature, and wet bulb temperature. Use the digital thermometers for temperature readings, air flow settings for the air flow, a digital scale for sand weight and a sling psychrometer for the wet and dry bulb temperatures.
6. Repeat the process for each set of settings, totaling four unique runs.
From the data collected, the following information can be obtained. Use psychrometric charts to determine the absolute humidity, which gives the concentration of water present in the air. The heat transfer coefficients can be calculated using the measured temperatures and Equation 1. And finally, the change in mass of the wet sand can be used to calculate the concentration of water in the sand.
The moisture content of sand decreased linearly over time. As expected, the evaporation rate was found to increase with larger flow rate and heat duty. According to their equations, both heat and mass transfer coefficients are directly proportional to the evaporation rate at the sand-air interface. Theoretical values of heat and mass transfer coefficients were found to have a strong positive correlation with a R2 of 99%. The experimental values only showed a weak correlation after testing.
The relationships between air flow and evaporation rate and between temperature and evaporation rate both increased linearly (Figure 1, Figure 2). Increased air flow (Figure 1) and increased temperature (Figure 2) both increased the evaporation rate. These graphs show that when air flow or temperature increase and the other variable is held constant, the evaporation rate will increase at an equivalent rate and follow a positive linear trend. The air flow variation test was a measure of convective heat transfer, while the temperature variation test was a measure of conductive heat transfer. The sum of the two tests shows that both convective and conductive heat transfer follow a linear relationship with evaporation rate.
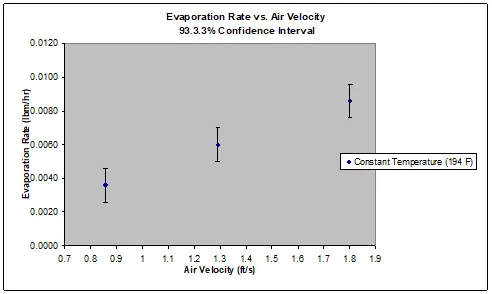
Figure 1: Depiction of the relationship between air velocity and evaporation rate, which increased linearly.
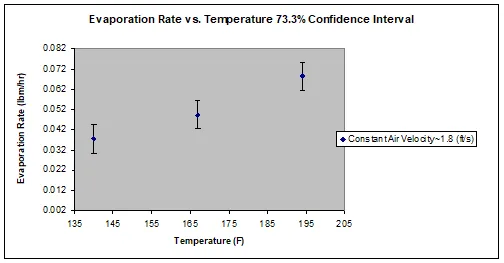
Figure 2: Depiction of the relationship between temperature and evaporation rate, which increased linearly.
There are many sources of error in the measurements with the greatest sources for error being the relative humidity and temperature of the air-sand interface. Also, the air velocity effect on the weight of the tray was deemed unimportant but it is a source of error. Some of this error may have also reduced the correlation of the heat and mass transfer coefficients. These coefficients were calculated theoretically and proven to be correlated. However, the experimental data did not show a significant trend, despite being theoretically similar.