Petroleum production Prospecting And Exploration
Petroleum production, recovery of crude oil and, often, associated natural gas from Earth.
Petroleum is a naturally occurring hydrocarbon material that is believed to have formed from animal and vegetable debris in deep sedimentarybeds. The petroleum, being less dense than the surrounding water, was expelled from the source beds and migrated upward through porous rock such as sandstone and some limestone until it was finally blocked by nonporous rock such as shale or dense limestone. In this way, petroleum deposits came to be trapped by geologic features caused by the folding, faulting, and erosion of Earth’s crust.
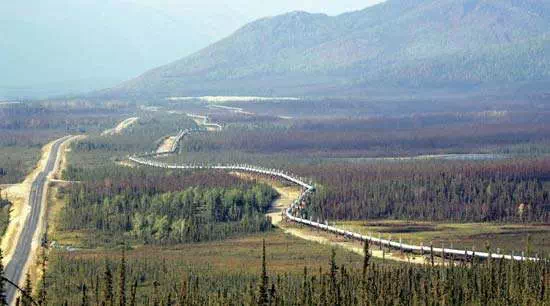
The Trans-Alaska Pipeline running parallel to a highway north of Fairbanks.Al Grillo/AP
Petroleum may exist in gaseous, liquid, or near-solid phases either alone or in combination. The liquid phase is commonly called crude oil, while the more-solid phase may be called bitumen, tar, pitch, or asphalt. When these phases occur together, gas usually overlies the liquid, and the liquid overlies the more-solid phase. Occasionally, petroleum deposits elevated during the formation of mountain ranges have been exposed by erosion to form tar deposits. Some of these deposits have been known and exploited throughout recorded history. Other near-surface deposits of liquid petroleum seep slowly to the surface through natural fissures in the overlying rock. Accumulations from these seeps, called rock oil, were used commercially in the 19th century to make lamp oil by simple distillation. The vast majority of petroleum deposits, however, lie trapped in the pores of natural rock at depths from 150 to 7,600 metres (500 to 25,000 feet) below the surface of the ground. As a general rule, the deeper deposits have higher internal pressures and contain greater quantities of gaseous hydrocarbons.
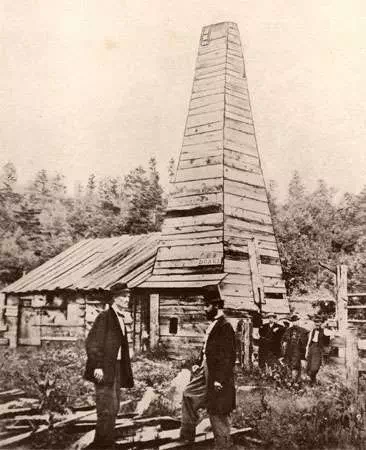
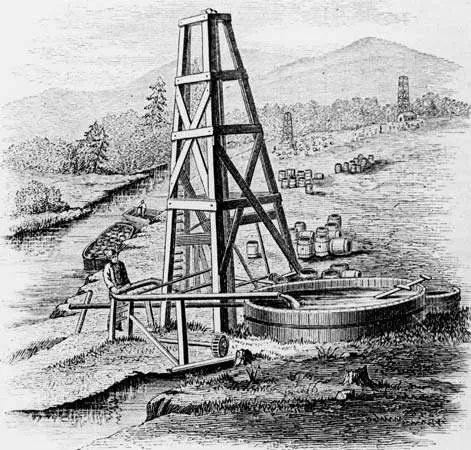
When it was discovered in the 19th century that rock oil would yield a distilled product (kerosene) suitable for lanterns, new sources of rock oil were eagerly sought. It is now generally agreed that the first well drilled specifically to find oil was that of Edwin Laurentine Drake in Titusville, Pennsylvania, U.S., in 1859. The success of this well, drilled close to an oil seep, prompted further drilling in the same vicinity and soon led to similar exploration elsewhere. By the end of the century, the growing demand for petroleum products resulted in the drilling of oil wells in other states and countries. In 1900, crude oil production worldwide was nearly 150 million barrels. Half of this total was produced in Russia, and most (80 percent) of the rest was produced in the United States (see alsodrilling machinery).
·
·
First oil well in the United States, built in 1859 by Edwin L. Drake, Titusville, Pennsylvania.
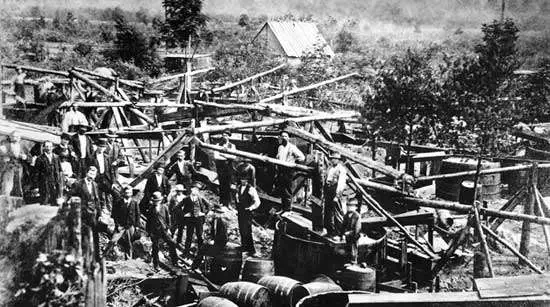
First oil wells pumping in the United States; owned by the Venango Company, Titusville, Pennsylvania, 1860.From the discovery of the first oil well in 1859 until 1870, the annual production of oil in the United States increased from about two thousand barrels to nearly ten million. In 1870 John D. Rockefeller formed the Standard Oil Company, which eventually controlled virtually the entire industry. The Standard, while ruthless in business methods, was largely responsible for the rapid growth of refining and distribution techniques.Library of Congress, Washington, D.C.
The advent and growth of automobile usage in the second decade of the 20th century created a great demand for petroleum products. Annual production surpassed one billion barrels in 1925 and two billion barrels in 1940. By the last decade of the 20th century, there were almost one million wells in more than 100 countries producing more than 20 billion barrels per year. By the end of the second decade of the 21st century, petroleum production had risen to nearly 34 billion barrels per year, of which an increasing share was supported by ultradeepwater drilling and unconventional crude production (in which petroleum is extracted from shales, tar sands, or bitumen or is recovered by other methods that differ from conventional drilling). Petroleum is produced on every continent except Antarctica, which is protected from petroleum exploration by an environmental protocol to the Antarctic Treaty until 2048.
Prospecting And Exploration
Drake’s original well was drilled close to a known surface seepage of crude oil. For years such seepages were the only reliable indicators of the presence of underground oil and gas. However, as demand grew, new methods were devised for evaluating the potential of underground rockformations. Today, exploring for oil requires integration of information collected from seismic surveys, geologic framing, geochemistry, petrophysics, geographic information systems (GIS) data gathering, geostatistics, drilling, reservoir engineering, and other surface and subsurface investigative techniques. Geophysical exploration including seismic analysis is the primary method of exploring for petroleum. Gravity and magnetic field methods are also historically reliable evaluation methods carrying over into more complex and challenging exploration environments, such as sub-salt structures and deep water. Beginning with GIS, gravity, magnetic, and seismic surveys allow geoscientists to efficiently focus the search for target assets to explore, thus lowering the risks associated with exploration drilling.
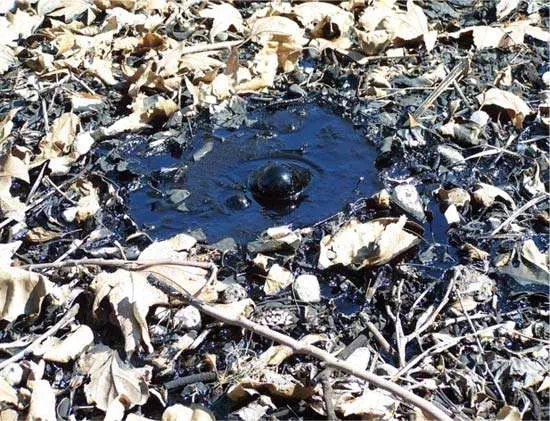
A natural oil seep.Courtesy of Norman J. Hyne Ph.D.
There are three major types of exploration methods: (1) surface methods, such as geologic feature mapping, enabled by GIS, (2) area surveys of gravity and magnetic fields, and (3) seismographic methods. These methods indicate the presence or absence of subsurface features that are favourable for petroleum accumulations. There is still no way to predict the presence of productive underground oil deposits with 100 percent accuracy.
Surface methods
Crude oil seeps sometimes appear as a tarlike deposit in a low area—such as the oil springs at Baku, Azerbaijan, on the Caspian Sea, described by Marco Polo. More often they occur as a thin skim of oil on small creeks that pass through an area. This latter phenomenon was responsible for the naming of Oil Creek in Pennsylvania, where Drake’s well was drilled. Seeps of natural gas usually cannot be seen, although instruments can detect natural gas concentrations in air as low as 1 part in 100,000. Similar instruments have been used to test for traces of gas in seawater. These geochemical surface prospecting methods are not applicable to the large majority of petroleum reservoirs, which do not have leakage to the surface.
Oil wells on Oil Creek, near the Allegheny River in Pennsylvania, U.S.; engraving by Edward H. Knight from the Dictionary of Mechanics, 1880.
Another method is based on surface indications of likely underground rock formations. In some cases, subsurface folds and faults in rock formations are repeated in the surface features. The presence of underground salt domes, for example, may be indicated by a low bulge in an otherwise flat ground surface. Uplifting and faulting in the rock formations surrounding these domes often result in oil and gas accumulations.
Gravity and magnetic surveys
Although gravity at Earth’s surface is very nearly constant, it is slightly greater where dense rock formations lie close to the surface. Gravitational force, therefore, increases over the tops of anticlinal (arch-shaped) folds and decreases over the tops of salt domes. Very small differences in gravitational force can be measured by a sensitive instrument known as the gravimeter. Measurements are made on a precise grid over a large area, and the results are mapped and interpreted to reflect the presence of potential oil- or gas-bearing formations.
Magnetic surveys make use of the magnetic properties of certain types of rock that, when close to the surface, affect Earth’s normal magnetic field. Again, sensitive instruments are used to map anomalies over large areas. Surveys are often carried out from aircraft over land areas and from oceangoing vessels over continental shelves. A similar method, called magnetotellurics (MT), measures the natural electromagnetic fieldat Earth’s surface. The different electrical resistivities of rock formations cause anomalies that, when mapped, are interpreted to reflect underground geologic features. MT is becoming a more cost-effective filter to identify a petroleum play (a set of oil fields or petroleum deposits with similar geologic characteristics) before more costly and time-intensive seismic surveying is conducted. MT is sensitive to what is contained within Earth’s stratographic layers. Crystalline rocks such as subsalts (that is, salts whose bases are not fully neutralized by acid) tend to be very resistive to electromagnetic waves, whereas porous rocks are usually conductive because of the seawater and brines contained within them. Petroleum geologists look to anomalies such as salt domes as indicators of potential stratigraphic traps for petroleum.
Seismographic methods
The survey methods described above can show the presence of large geologic anomalies such as anticlines (arch-shaped folds in subterranean layers of rock), fault blocks (sections of rock layers separated by a fracture or break), and salt domes, even though there may not be surface indications of their presence. However, they cannot be relied upon to find smaller and less obvious traps and unconformities (gaps) in the stratigraphic arrangement of rock layers that may harbour petroleum reservoirs. These can be detected and located by seismic surveying, which makes use of the sound-transmitting and sound-reflecting properties of underground rock formations. Seismic wavestravel at different velocities through different types of rock formations and are reflected by the interfaces between different types of rocks. The sound-wave source is usually a small explosion in a shallow drilled hole. Microphones are placed at various distances and directions from the explosive point to pick up and record the transmitted and reflected sound-wave arrivals. The procedure is repeated at intervals over a wide area. An experienced seismologist can then interpret the collected records to map the underground formation contours. Offshore and land-based seismic data collection varies primarily by method of setup. For offshore seismic surveys, one of the most critical components of petroleum exploration is knowing where the ship and receivers are at all times, which is facilitated by relaying global positioning system (GPS) readings in real time from satellites to GPS reference and monitoring stations and then to the ship. Readings in real time have become part of the process of seismic sound-wave capture, data processing, and analysis.
Offshore seismic acquisition
Sound is often generated by air guns, and the sonic returns produce images of the shear waves in the water and subsurface. Towed hydrophone arrays (also called hydrophone streamers) detect the sound waves that return to the surface through the water and sub-seafloor strata. Reflected sound is recorded for the elapsed travel time and the strength of the returning sound waves. Successful seismic processing requires an accurate reading of the returning sound waves, taking into account how the various gaseous, liquid, and solid media the sound waves travel through affect the progress of the sound waves. Two-dimensional (2-D) seismic data are collected from each ship that tows a single hydrophone streamer. The results display as a single vertical plane or in cross section that appears to slice into the subsurface beneath the seismic line. Interpretation outside the plane is not possible with two-dimensional surveys; however, it is possible with three-dimensional (3-D) ones. The utility of 2-D surveys is in general petroleum exploration or frontier exploration. In this work, broad reconnaissance is often required to identify focus areas for follow-up analysis using 3-D techniques.
Seismic data collection in three dimensions employs one or more towed hydrophone streamers. The arrays are oriented so that they are towed in a linear fashion, such as in a “rake” pattern (where several lines are towed in parallel), to cover the area of interest. The results display as a three-dimensional cube in the computer environment. The cube can be sliced and rotated by using various software for processing and analysis. In addition to better resolution, 3-D processed data produce spatially continuous results, which help to reduce the uncertainty in marking the boundaries of a deposit, especially in areas where the geology is structurally complex or in cases where the deposits are small and thus easily overlooked. Going one step further, two 3-D data sets from different periods of time can be combined to show volumetric or other changes in oil, water, or gas in a reservoir, essentially producing a four-dimensional seismic survey with time being the fourth dimension. On rare occasions and at shallower depths, receivers can be physically placed on the seafloor. Cost and time factor into this method of data acquisition, but this technique may be preferred when towing hydrophone streamers would be problematic, such as in shipping lanes or near rigid offshore structures or commercial fishing operations.
Land-based seismic acquisition
Onshore seismic data have been acquired by using explosions of dynamite to produce sound waves as well as by using the more environmentally sensitive vibroseis system (a vibrating mechanism that creates seismic waves by striking Earth’s surface). Dynamite is used away from populated areas where detonation can be secured in plugged shot holes below the surface layer. This method is preferred to vibroseis, since it gives sharp, clean sound waves. However, more exploration efforts are shifting to vibroseis, which incorporates trucks capable of pounding the surface with up to nearly 32 metric tons (approximately 35 tons) of force. Surface pounding creates vibrations that produce seismic waves, which generate data similar to those of offshore recordings.
Processing and visualization
Processing onshore and offshore seismic data is a complex effort. It begins with filtering massive amounts of data for output and background noise during seismic capture. The filtered data are then formally processed—which involves the deconvolution (or sharpening) of the “squiggly lines” correlating to rock layers, the gathering and summing of stacked seismic traces (digital curves or returns from seismic surveys) from the same reflecting points, the focusing of seismic traces to fill in the gaps or smoothed-over areas that lack trace data, and the manipulation of the output to give the true, original positions of the trace data. With more computer power, integrating seismic processing and its analysis with other activities that define the geologic context of the scanned area has become a routine task in the 21st century. Visualizing the collected data for purposes of exploration and production began with the introduction of interpretation workstations in the early 1980s, and technology designed to help researchers interpret volumetric pixels(3-D pixels, or “voxels”) became available in the early 1990s. Advances in graphics, high-performance computing, and artificial intelligencesupported and expanded data visualization tasks. By the early 21st century, data visualization in oil exploration and production was integrating these advances while also illustrating to the geoscientist and engineer the increasing uncertainty and complexity of the available information.
Visualization setups incorporate seismic data alongside well logs(physical data profiles taken in or around a well or borehole) or petrophysical data taken from cores (cylindrical rock samples). The visualization setups typically house complex data and processes to convert statistical data into graphical analyses in multiple sizes or shapes. The data display can vary widely, with front or rear projections from spherical, cylindrical, conical, or flat screens; screen sizes range from small computer monitors to large-scale dome configurations. The key results from using visualization are simulations depicting interactive reservoirs of flowing oil and trials designed to test uncertain geological features at or below the resolution of seismic data.