Liquefied Natural Gas
What is LNG?
An ocean-going LNG carrier
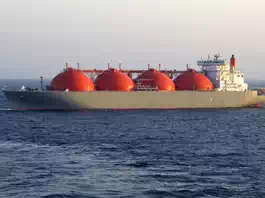
Liquefied natural gas (LNG) is natural gas that has been cooled to a liquid state, at about -260°Fahrenheit, for shipping and storage. The volume of natural gas in its liquid state is about 600 times smaller than its volume in its gaseous state. This process, which was developed in the 19th century, makes it possible to transport natural gas to places pipelines do not reach and to use natural gas as a transportation fuel.
LNG increases markets for natural gas
Where natural gas pipelines are not feasible or do not exist, liquefying natural gas is a way to move natural gas from producing regions to markets, such as to and from the United States and countries in Asia or Europe. LNG is shipped in special ocean-going ships (tankers) between export terminals, where natural gas is liquefied, and import terminals, where LNG is returned to its gaseous state (regasified). At an import terminal, it can be injected into pipelines for transmission to distribution companies, industrial consumers, and power plants. Most LNG is transported by large ships/tankers called LNG carriersthat are equipped with onboard, super-cooled cryogenic tanks. LNG is also transported in relatively small volumes on ships using International Organization for Standardization (ISO)-compliant containers and on trucks. LNG can be used as a fuel for ships, trucks, and buses with specially designed fuel tanks. Some power plants store LNG and use it to generate electricity when electricity demand is high and their natural gas demand exceeds pipeline delivery capacity.
The United States imports and exports LNG
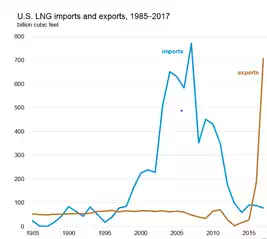
In recent years, the United States has become a net exporter of LNG, largely because of increasing U.S. natural gas production, declining imports of LNG, and expansion of LNG export terminal capacity. The United States imported very small amounts of LNG until 1995, and then LNG imports generally increased each year until peaking in 2007 at about 771 billion cubic feet (Bcf). Increases in U.S. natural gas production and expansion of natural gas pipelines have reduced the need to import natural gas. LNG imports declined in most years since 2007. In 2017, the United States imported about 78 Bcf of LNG—the lowest amount since 1997—from three countries:
· Trinidad and Tobago–70 Bcf
· Nigeria–6 Bcf
· Canada–2 Bcf
Most of U.S. LNG imports are into the Everett regasification terminal near Boston, Massachusetts. Massachusetts, Connecticut, Maine, New Hampshire, Vermont, and Rhode Island may have significant pipeline constraints when heating demand increases substantially during periods of very cold weather. LNG imports help to meet natural gas demand in New England because the region currently has limited pipeline interconnections with the Northeast and U.S. producing regions.
In 2017, the U.S. exported about 708 Bcf of LNG to 28 countries, more than in any previous year. The top five destination countries and their shares of total U.S. LNG exports in 2017 were
· Mexico–20%
· South Korea–18%
· China–15%
· Japan–8%
· Jordan–5%
In 2017, nearly all U.S. LNG exports were transported on LNG carriers. Less than 1 Bcf was exported to Barbados and the Bahamas on small tankers equipped with ISO containers. Less than 1 Bcf of LNG was exported by truck to Canada and Mexico.
Sometimes the U.S. re-exports natural gas that it originally imported when natural gas prices are favorable to do so. About 0.4 Bcf of LNG was re-exported to Mexico in 2017.
U.S. LNG exports are expected to increase in coming years as new U.S. LNG export capacity comes online. Our data file provides detailed information on existing and under-construction large-scale U.S. liquefaction facilities.
Where Our Natural Gas Comes From
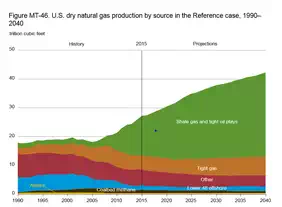
The United States now produces nearly all of the natural gas that it uses
U.S. natural gas production in 2016 was the second-highest level recorded, down slightly from 2015, which has the highest-recorded production level. Production increases since 2005 have mainly been the result of horizontal drilling and hydraulic fracturing techniques, notably in shale, sandstone, carbonate, and other tight geologic formations. Natural gas is produced from onshore and offshore natural gas and oil wells and from coal beds. In 2016, U.S. dry natural gas production was equal to about 97% of U.S. natural gas consumption.
Five states accounted for about 65% of total U.S. dry natural gas production in 2016:
· Texas—24%
· Pennsylvania—20%
· Oklahoma—9%
· Louisiana—6%
· Wyoming—5%
What is shale?
Shale is a fine-grained sedimentary rock that forms when silt and clay-size mineral particles are compacted, and it is easily broken into thin, parallel layers. Black shale contains organic material that can generate oil and natural gas, which is trapped within the rock's pores.
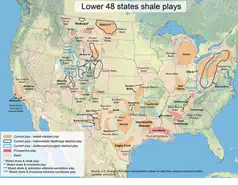
Where are shale gas resources found?
Shale natural gas resources are found in shale formations that contain significant accumulations of natural gas and/or oil. The Barnett Shale in Texas has been producing natural gas for more than a decade. Information gained from developing the Barnett Shale provided the initial technology template for developing other shale plays in the United States. Another important shale natural gas play is the Marcellus Shale in the eastern United States. While the Barnett and Marcellus formations are well-known shale natural gas plays in the United States, more than 30 U.S. states have shale formations.
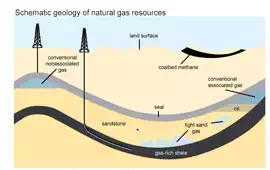
Shale gas and tight gas
The oil and natural gas industry generally distinguishes between two categories of low-permeability formations that produce natural gas:
· Shale natural gas
· Tight natural gas
Shale natural gas
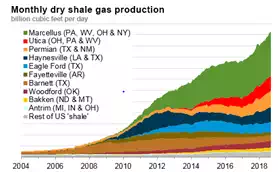
Large-scale natural gas production from shale began around 2000, when shale gas production became a commercial reality in the Barnett Shale located in north-central Texas. The production of Barnett Shale natural gas was pioneered by the Mitchell Energy and Development Corporation. During the 1980s and 1990s, Mitchell Energy experimented with alternative methods of hydraulically fracturing the Barnett Shale. By 2000, the company had developed a hydraulic fracturing technique that produced commercial volumes of shale gas. As the commercial success of the Barnett Shale became apparent, other companies started drilling wells in this formation so that by 2005, the Barnett Shale was producing almost half a trillion cubic feet (Tcf) of natural gas per year. As natural gas producers gained confidence in their abilities to profitably produce natural gas in the Barnett Shale, with confirmation provided by well results in the Fayetteville Shale in northern Arkansas, producers started developing other shale formations–including the Haynesville in eastern Texas and north Louisiana, the Woodford in Oklahoma, the Eagle Ford in southern Texas, and the Marcellus and Utica shales in northern Appalachia.
Tight natural gas
The identification of tight natural gas as a separate production category began with the passage of the Natural Gas Policy Act of 1978 (NGPA), which established tight natural gas as a separate wellhead natural gas pricing category that could obtain unregulated market-determined prices. The tight natural gas category was designed to give producers an incentive to produce high-cost natural gas resources when U.S. natural gas resources were believed to be increasingly scarce.
As a result of the NGPA tight natural gas price incentive, these resources have been in production since the early 1980s, primarily from low-permeability sandstones and carbonate formations, with a small production volume coming from eastern Devonian shale. With the full deregulation of wellhead natural gas prices and the repeal of the associated Federal Energy Regulatory Commission (FERC) regulations, tight natural gas no longer had a specifically defined meaning, but generically still refers to natural gas produced from low-permeability sandstone and carbonate reservoirs.
Notable tight natural gas formations include, but are not confined to
· Clinton, Medina, and Tuscarora formations in Appalachia
· Berea sandstone in Michigan
· Bossier, Cotton Valley, Olmos, Vicksburg, and Wilcox Lobo along the Gulf Coast
· Granite Wash and Atoka formations in the Midcontinent
· Canyon formation in the Permian Basin
· Mesaverde and Niobrara formations in multiple Rocky Mountain basins
The United States has abundant shale gas resources
The United States has access to significant shale natural gas resources. In the U.S. Crude Oil and Natural Gas Proved Reserves(December 2016), the U.S. Energy Information Administration estimated that the United States has about 200 trillion cubic feet of proved shale gas resources. In the World Shale Resource Assessments report (September 2015), the U.S. is estimated to have nearly 623 trillion cubic feet of additional unproved technically recoverable shale gas resources.
Offshore natural gas production
Although most of the natural gas and oil wells in the United States are on land, some wells are drilled into the ocean floor in waters off the coast of the United States. Most of U.S. offshore natural gas production occurs in federal waters in the Gulf of Mexico, the source of about 4% of U.S. dry natural gas production in 2016.
Coalbed methane and supplemental gaseous fuels
The United States obtains methane from coal beds. In 2016, U.S. coalbed methane production was equal to about 4% of total U.S. natural gas consumption.
Supplemental gaseous fuels include blast furnace gas, refinery gas, biomass gas, propane-air mixtures, and synthetic natural gas (natural gas made from petroleum hydrocarbons or from coal). These supplemental supplies were equal to about 0.2% of U.S. natural gas consumption in 2015. The largest source of synthetic natural gas is the Great Plains Synfuels Plant in Beulah, North Dakota, where coal is converted to pipeline-quality natural gas.
|
Natural Gas Imports and Exports |
Most of U.S. natural gas imports are from Canada
In 2017, about 97% of U.S. total annual natural gas imports were from Canada and nearly all by pipelines. A small amount of compressed natural gas (CNG) came by truck from Canada—less than 0.1% of total imports. About 3% of total natural gas imports came as LNG, 90% of which were from Trinidad and Tobago. U.S. natural gas imports are generally highest in winter when imports help meet increases in natural gas demand for heating.
Natural gas imports are declining
Total annual imports of natural gas generally declined since 2007, mainly because increases in U.S. natural gas production have reduced the need for imports. Total annual imports peaked in 2007 at about 5 trillion cubic feet (Tcf). In 2017, total annual imports were 3.04 Tcf.
Natural gas exports are increasing
Up until the year 2000, the United States exported relatively small volumes of natural gas and mostly by pipeline to Mexico and Canada. Total annual exports have generally increased each year since 2000 as increases in U.S. natural gas production contributed to lower natural gas prices and the competitiveness of U.S. natural gas in international markets.
In 2017, total annual natural gas exports were 3.17 Tcf—the highest on record, exports were larger than imports for the first time in 60 years, and the United States became a net exporter of natural gas.
Most—78%—of the total natural gas exports in 2017 were by pipeline, 63% of which went to Mexico. Exports of LNG increased substantially in 2016 and 2017, coinciding with a nearly five-fold increase in export capacity since 2015. The United States exported natural gas to 28 countries in 2017.