Imports and Exports of Hydrocarbon Gas Liquids
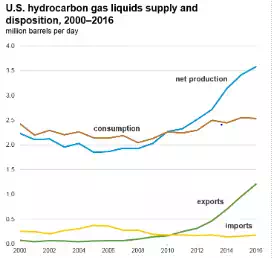
Imports of hydrocarbon gas liquids help meet seasonal and regional demand
The United States typically produces more hydrocarbon gas liquids (HGL) than it uses on an annual basis. However, sometimes imports of HGL are necessary to supply high, seasonal demand and to supply some regions of the country that are not supplied sufficiently by domestic sources. Certain HGL, such as propylene, are also imported because U.S. production is insufficient to satisfy total petrochemical demand. In 2016, HGL imports of 180,000 barrels per day (b/d) accounted for about 8% of total U.S. imports of petroleum products (does not include crude oil). Approximately 67% of the HGL imports were propane. Normal butane and isobutane together accounted for slightly more than 12% of the HGL imports, followed by natural gasoline at slightly less than 8%. Olefins (propylene and normal butylene) together contributed about 14% of the HGL import volumes in 2016.
Most U.S. imports of propane and butanes are received by rail from Canada into the Midwest and Northeast regions of the United States. These imports are highly seasonal, with two-thirds of all imports occurring October through March. This demand cycle reflects use of propane as a heating fuel and of butanes in gasoline blending during colder months when gasoline vapor pressure requirements allow its use in higher quantities. In 2016, 89% of U.S. HGL imports were from Canada, and the rest was imported on ships from overseas. In 2016, U.S. HGL imports were about one-seventh as large as U.S. HGL exports.
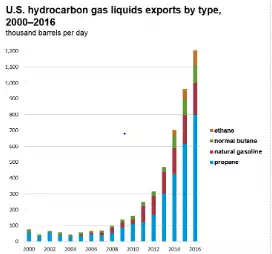
Exports of hydrocarbon gas liquids have increased substantially since 2007
Exports of HGL increased from about 70,000 b/d in 2007 to 1.2 million b/d in 2016, which was equal to 20% of total U.S. exports of petroleum in 2016. These exports were largely driven by annual U.S. production exceeding annual U.S. demand. The increases in HGL production were largely the result of increases in production of wet natural gas from shale gas and tight oil resources. The approximate shares of HGL exports by type
· Propane—66%
· Natural gasoline (pentanes plus)—17%
· Normal butane and isobutane combined—10%
· Ethane—8%
Propane was exported from the United States to 56 countries in 2016. The top
five destinations and their share of total U.S. propane exports:
· Japan—19%
· Mexico—14%
· China—12%
· Netherlands—8%
· South Korea—7%
In 2016, 99% of natural gasoline exports were sent to Canada. Most of the natural gasoline exported to Canada is mixed into the oil produced from oil sands in Alberta, Canada, so that the oil can be transported by pipelines and rail, primarily to U.S. destinations.
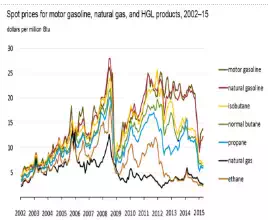
Prices for Hydrocarbon Gas Liquids
Hydrocarbon gas liquid prices are related to oil and natural gas prices and related to supply and demand
Prices for hydrocarbon gas liquids (HGL) are related to their sources (crude oil and natural gas) and to their demand and supply. Until 2009, U.S. spot prices for natural gas and crude oil were closely related, in terms of dollars per million British thermal unit (Btu), and the U.S. spot price for propane generally tracked closely to the spot price for West Texas Intermediate (WTI) crude oil. This historical relationship, which reflected international market trends, was based on the general assumption that most fuels are interchangeable, because the United States was a net importer of propane and other HGL products. As a result, prices of HGL in the United States were bound by international market dynamics.
In 2011, the spot prices of propane at the Mont Belvieu, Texas trading hub began to move away from the spot prices of crude oil and refined products such as gasoline and naphtha (on a dollar per Btu basis). Initially, this move reflected the switch in the U.S. trade position from a net importer to a net exporter of propane. By 2013 and 2014, the surplus of propane stocks in the United States (that resulted from continuing increases in production, particularly from natural gas processing plants) began to exceed the capacity of export terminals to send the product to overseas markets, depressing the U.S. price of propane even further. Normal butane prices began to exhibit similar behavior in early 2012, and isobutane prices began to fall closer to propane prices by early 2013, reflecting the high cost required to move U.S.-produced HGL to overseas markets. Although in absolute terms (dollar per Btu), the difference between liquefied petroleum gas prices in the United States and in the international market has narrowed; because of the decline in crude prices and high transportation costs to distant markets overseas, the relative discounts (in percentage terms) are at historical highs.
U.S. spot prices for ethane generally tracked crude oil spot prices until 2008. Gradually, as production growth in the United States overwhelmed the ability of the domestic petrochemical industry to increase its consumption of ethane, the price of this commodity delinked from crude oil prices, and since mid-2012, began to closely track natural gas prices. Because the only alternative market for ethane currently is as a component of pipeline natural gas (known as ethane rejection), current ethane prices reflect its heating value.