Boiling Point Elevation and Freezing Point Depression
The colligative properties really depend on the escaping tendency of solvent molecules from the liquid phase. You will recall that the vapor pressure is a direct measure of escaping tendency, so we can use these terms more or less interchangeably.
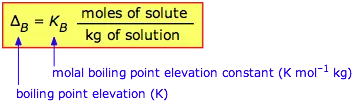
If addition of a nonvolatile solute lowers the vapor pressure of the solution via Raoult's law , then it follows that the temperature must be raised to restore the vapor pressure to the value corresponding to the pure solvent. In particular, the temperature at which the vapor pressure is 1 atm will be higher than the normal boiling point by an amount known as the boiling point elevation . The exact relation between the boiling point of the solution and the mole fraction of the solvent is rather complicated, but for dilute solutions the elevation of the boiling point is directly proportional to the molal concentration of the solute:
Bear in mind that the proportionality constant KB is a property of the solvent because this is the only component that contributes to the vapor pressure in the model we are considering in this section.
Table 8.4.18.4.1: Boiling point elevation constants | ||
solvent | normal bp, °C | Kb , K mol–1 kg |
water | 100 | 0.514 |
ethanol | 79 | 1.19 |
acetic acid | 118 | 2.93 |
carbon tetrachloride | 76.5 | 5.03 |
The freezing point of a substance is the temperature at which the solid and liquid forms can coexist indefinitely — that is, they are in equilibrium. Under these conditions molecules pass between the two phases at equal rates because their escaping tendencies from the two phases are identical. Suppose that a liquid solvent and its solid (water and ice, for example) are in equilibrium (![]() below), and we add a non-volatile solute (such as salt, sugar, or automotive antifreeze liquid) to the water. This will have the effect of reducing the mole fraction of H2O molecules in the liquid phase, and thus reduce the tendency of these molecules to escape from it, not only into the vapor phase (as we saw above), but also into the solid (ice) phase. This will have no effect on the rate at which H2O molecules escape from the ice into the water phase, so the system will no longer be in equilibrium and the ice will begin to melt
below), and we add a non-volatile solute (such as salt, sugar, or automotive antifreeze liquid) to the water. This will have the effect of reducing the mole fraction of H2O molecules in the liquid phase, and thus reduce the tendency of these molecules to escape from it, not only into the vapor phase (as we saw above), but also into the solid (ice) phase. This will have no effect on the rate at which H2O molecules escape from the ice into the water phase, so the system will no longer be in equilibrium and the ice will begin to melt![]() .
.
If we wish to keep the solid from melting, the escaping tendency of molecules from the solid must be reduced. This can be accomplished by reducing the temperature; this lowers the escaping tendency of molecules from both phases, but it affects those in the solid more than those in the liquid, so we eventually reach the new, lower freezing point where the two quantities are again in exact balance and both phases can coexist ![]() .
.
If you prefer to think in terms of vapor pressures, you can use the same argument if you bear in mind that the vapor pressures of the solid and liquid must be the same at the freezing point. Dilution of the liquid (the solvent) by the nonvolatile solute reduces the vapor pressure of the solvent according to Raoult’s law, thus reducing the temperature at which the vapor pressures of the liquid and frozen forms of the solution will be equal. As with boiling point elevation, in dilute solutions there is a simple linear relation between the freezing point depression and the molality of the solute:
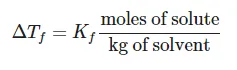
Note that Kf values are all negative!
Table 8.4.28.4.2: Freezing point depression constants | ||
Solvent | Normal Freezing Point (°C) | Kf (K mol–1 kg) |
water | 0.0 | –1.86 |
acetic acid | 16.7 | –3.90 |
benzene | 5.5 | –5.10 |
camphor | 180 | –40.0 |
cyclohexane | 6.5 | –20.2 |
phenol | 40 | –7.3 |
Automotive radiator antifreezes are mostly based on ethylene glycol, (CH2OH)2. Owing to the strong hydrogen-bonding properties of this double alcohol, this substance is miscible with water in all proportions, and contributes only a very small vapor pressure of its own. Besides lowering the freezing point, antifreeze also raises the boiling point, increasing the operating range of the cooling system. The pure glycol freezes at –12.9°C and boils at 197°C, allowing water-glycol mixtures to be tailored to a wide range of conditions.
A simple phase diagram can provide more insight into these phenomena. You may already be familiar with the phase map for water below.

The one shown below expands on this by plotting lines for both pure water and for its "diluted" state produced by the introduction of a non-volatile solute.
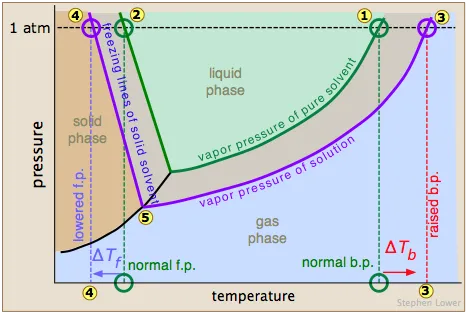
The normal boiling point of the pure solvent is indicated by point ![]() where the vapor pressure curve intersects the 1-atm line — that is, where the escaping tendency of solvent molecules from the liquid is equivalent to 1 atmosphere pressure. Addition of a non-volatile solute reduces the vapor pressures to the values given by the blue line. This shifts the boiling point to the right
where the vapor pressure curve intersects the 1-atm line — that is, where the escaping tendency of solvent molecules from the liquid is equivalent to 1 atmosphere pressure. Addition of a non-volatile solute reduces the vapor pressures to the values given by the blue line. This shifts the boiling point to the right ![]() , corresponding to the increase in temperature ΔTb required to raise the escaping tendency of the H2O molecules back up to 1 atm.
, corresponding to the increase in temperature ΔTb required to raise the escaping tendency of the H2O molecules back up to 1 atm.
To understand freezing point depression, notice that the vapor pressure line intersects the curved black vapor pressure line of the solid (ice), which corresponds to a new triple point ![]() at which all three phases (ice, water vapor, and liquid water) are in equilibrium and thus exhibit equal escaping tendencies. This point is by definition the origin of the freezing (solid-liquid) line, which intersects the 1-atm line at a reduced freezing point ΔTf, indicated by
at which all three phases (ice, water vapor, and liquid water) are in equilibrium and thus exhibit equal escaping tendencies. This point is by definition the origin of the freezing (solid-liquid) line, which intersects the 1-atm line at a reduced freezing point ΔTf, indicated by ![]() .
.
Note that the above analysis assumes that the solute is soluble only in the liquid solvent, but not in its solid form. This is generally more or less true. For example, when arctic ice forms from seawater, the salts get mostly "squeezed" out. This has the interesting effect of making the water that remains more saline, and hence more dense, causing it to sink to the bottom part of the ocean where it gets taken up by the south-flowing deep current.
Those readers who have some knowledge of thermodynamics will recognize that what we have been referring to as "escaping" tendency is really a manifestation of the Gibbs Energy. This schematic plot shows how the G's for the solid, liquid, and gas phases of a typical substance vary with the temperature.
The rule is that the phase with the most negative free energy rules.
The phase that is most stable (and which therefore is the only one that exists) is always the one having the most negative free energy (indicated here by the thicker portions of the plotted lines.) The melting and boiling points correspond to the respective temperatures where the solid and liquid ![]() and liquid and vapor
and liquid and vapor ![]() have identical free energies.
have identical free energies.
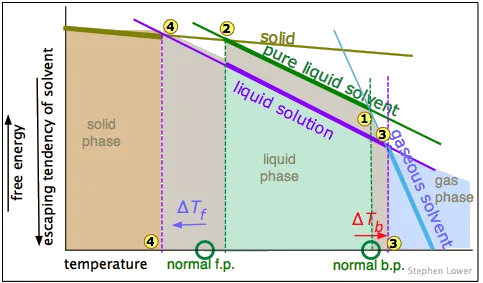
As we saw above, adding a solute to the liquid dilutes it, making its free energy more negative, with the result that the freezing and boiling points are shifted to the left and right, respectively.
The relationships shown in these plots depend on the differing slopes of the lines representing the free energies of the phases as the temperature changes. These slopes are proportional to the entropy of each phase. Because gases have the highest entropies, the slope of the "gaseous solvent" line is much greater than that of the others. Note that this plot is not to scale.