Lead-silver system
Lead-silver system is a two component system. The phase diagram of this system is shown in fig. Lead and silver are immiscible with each other in liquid state. And do not react with each other.
Composition of liquid state is taken on X-axis and temperature on Y-axis. And pressure is kept constant throughout the experiment. Point ‘A’ is freezing point of pure lead, it means, solid and liquid phase of lead are D in equilibrium at this point. Now, if silver is added in it, its freezing point decreases and solid lead and solution of silver in lead (liquid) come in equilibrium and we get curve AO.
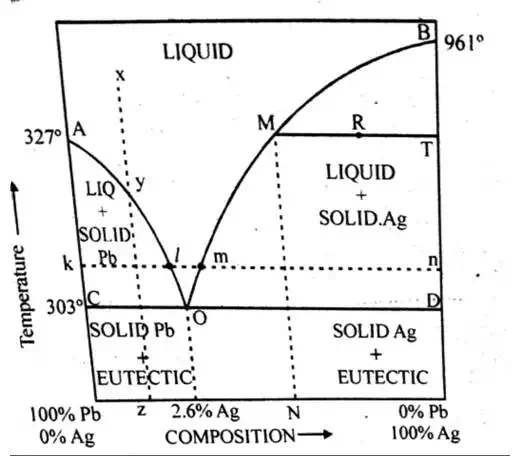
At ‘O’ silver is 2.6% and point ‘B’ is freezing point of pure silver therefore solid silver and liquid silver are in equilibrium at this point. If lead is added in it, its freezing point decreases and solid silver and solution of lead in silver (liquid) come in equilibrium and we get curve BO. Temprature at ‘O’ is 303°C. Liquid phase disappears below this temprature.
Following are the main features of this system.
1. Curves AO and OB represent monovariant system.
2. Different areas represent bivariant system.
3. Point ‘O’ represent eutectic point which represents non variant system.
Now we shall discuss them in Detail.
Curve AO
A is the freezing point of pure lead. At this point (327°C) solid lead is in equilibrium with liquid lead. When pure silver is added to lead metal, the freezing point of lead lowers along the curves AO. Thus AO is the freezing point curve of lead in presence of silver.
Along this curve solid lead is in equilibrium with liquid melt ( solution of silver in lead). Therefore, there are two phases along this curve at any point and Number of components are two, on applying condensed phase rule.
F= C-P+1 = 2-2+1=1
Therefore, the system is univarient at any point on the curve.
Curve BO
Point B indicates the melting point of pure silver (961°C). When amounts of lead are added the freezing point of silver lowers along the curve BO. This Curve is called the freezing point curve of silver. Here solid silver is in equilibrium with the liquid melt (solution of lead in silver) along this curve. Thus, there are two phases at any point on this curve. Again on applying the condensed phase rule, we get F=1. This curve is also univariant like AO.
Eutectic point ‘O’
Two curve AO and BO meet at point ‘O’. This point, being common to both the curves, represent the condition under which three phases solid lead, solid silver and melt (solution) are in equilibrium. The degree of freedom at this point is zero which follows from the reduced phase rule.
F=C-P+1 = 2-3+1 =0
Thus, the point O is non variant. This point lies at a temperature (303°C) which is lower than the melting point of silver as well as lead metal. The composition at this point is Ag (2.6%) and lead (97.4%). Therefore, the point O is called the eutectic point i.e. the lowest temperature at which the liquid melt can exist. The temprature at this point is called eutectic temprature. And composition at this point O is known as eutectic mixture. Although the mixture behaves like a compound, but actually it is not a compound since metals are in not stoichiometric proportion.
Area ACO and BDO
In area ACO Solid lead and melt are in equilibrium whereas, in area BDO solid silver and melt are in equilibrium. Therefore, two phases exist in these areas which follows that system is monovariant in these regions. Composition of liquid phase can be determined by drawing a horizontal line from this point which is called a Tie line.
Area above curve AOB- In this area, silver and lead are present as a homogeneous liquid solution. Thus, there is only one phase in this region. Applying the condensed rule to any point in this area, we obtain
F=C-P+1 = 2-1+1=2
Therefore, system is bivariant in this area.
Area below line COD :
No liquid phase in present below line COD. Solid silver and solid lead are present in this area as two different phases. This is a monovariant system. The variable is temprature. Let us consider an isothermal phase change on line klmn. At k, solid lead is present, when silver is added in its another phase i.e. liquid (silver solution in lead) comes into existence. On further going from k to l (i.e. on further addition of silver in lead) solid lead decreases and melt increases and lead becomes minimum at l.
Melt dominates within lm i.e. solid lead converts into liquid. At point m, silver crystals begin to appear i.e. solid silver and melt come into equilibrium. From m to n concentration of Melt decreases and that of solid silver increase and finally at n only solid silver exists, and melt disappears.
Conclusion
So our article is finished and after completely reading this article, one can easily tell what is phase diagram of lead-silver system is. And how we can explain it.
So one can say that they got a detailed information about lead-silver system. We have already discussed Application of phase diagram : water system, Application of phase diagram : carbon dioxide system and Application of phase diagram : sulphur system in earlier articles. You can visit there for more information.