Influence of Metal Microstructures
The internal structure of a component will influence how sound propagates through it. Most metal specimens are comprised of small single crystals called “grains”. Depending on the metal used and its processing history, the average grain size can range from a few microns to many centimeters. Some metal specimens, such as Nickel alloys used in jet engine components have one primary type of grain (i.e., grains of “one phase”). Other metal specimens contain more than one phase. For example jet-engine titanium alloys often contain a mixture of grains having cubic and hexagonal symmetries, respectively.
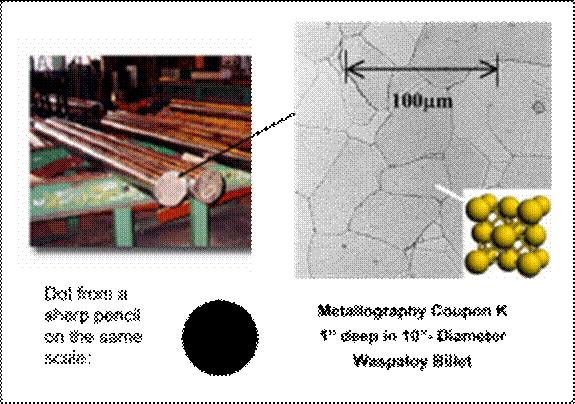
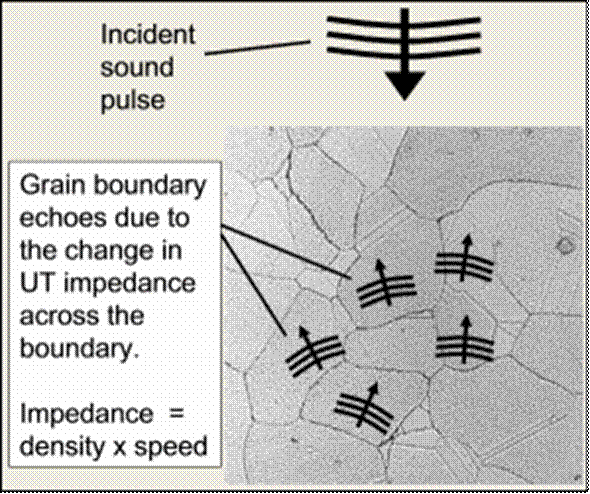
The speed of sound through a given grain depends on the direction of sound propagation with respect to the crystalline symmetry axes. When a sound wave encounters a boundary between two grains, the change in sonic properties causes some of the incident sound energy to be reflected. This leads to detectable ultrasonic signals known as “grain noise”. On the one hand, such noise can hamper an inspection for a small or subtle defect. On the other hand it can also be used as a tool for material characterization, e.g., for making grain size estimates. The microstructure of a metal is also responsible for a phenomenon known as ultrasonic attenuation. Attenuation describes the loss of energy (due to scattering and absorption) of a sound pulse as it propagates through a material.
Signal-to-Noise Ratios
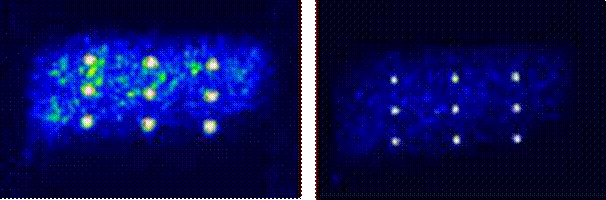
The relative strengths of observed defect signals and grain noise depend on many factors including the UT instrument being used, the frequency and focusing properties of the transducer, the surface curvature, and the metal microstructure itself. In defect detection work, one endeavors to choose inspection parameters that maximize the signal-to-noise (S/N) ratio, ie. the response from the defect divided by the average response from the competing grain noise. For material characterization work, on the other hand, it is often useful to choose inspection parameters that maximize the backscattered grain noise. Below are two ultrasonic C-scans of a metal specimen containing a set of nine reference reflectors, namely flat-bottomed holes (FBH’s) each having a diameter of 1/64 inch. For the inspection on the right the ultrasonic responses from the holes stand out more clearly from the grain noise background. We will revisit this same figure later when we discuss the concept of ultrasonic pulse volume and its relationship to S/N ratios.
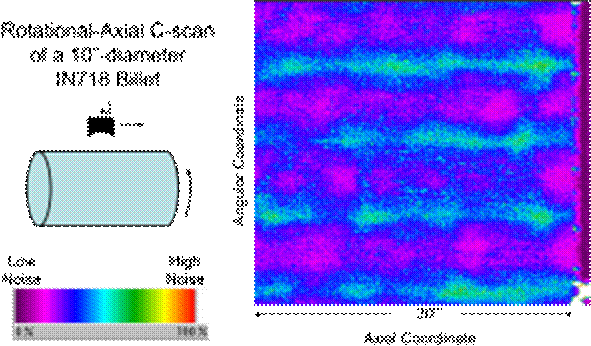
Below is a C-scan from the inspection of a cylindrical Nickel-alloy billet with the gain (signal amplification) boosted to highlight the backscattered grain noise. There one sees obvious variations in backscattered grain noise with position. Upon further study, these were traced to gradual, systematic changes in the average grain diameter from region to region, with regions having larger grains producing more backscatter.
Grain Noise Models
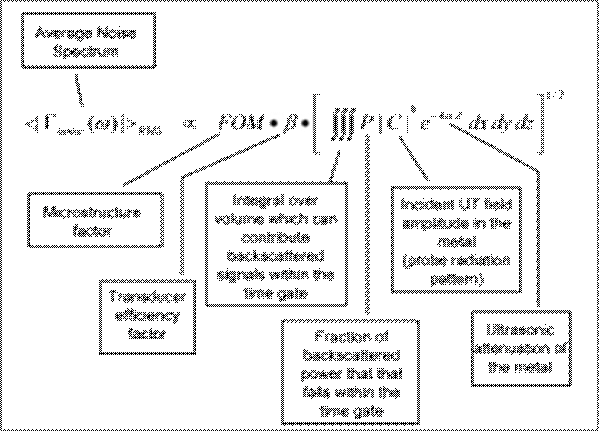
Physics-based models have been developed at CNDE which simulate various aspects of an ultrasonic inspection. Some of the models predict the ultrasonic fields generated within the component by the action of the transducer. Other predict the reflected responses from surfaces and hypothetical defects within the component. Another class of models predict average grain noise levels and other statistical properties of grain noise distributions. The figure below illustrates one of the model formulas from the so-called “Independent Scatterer Model”, with the physical meanings of some of the factors described.
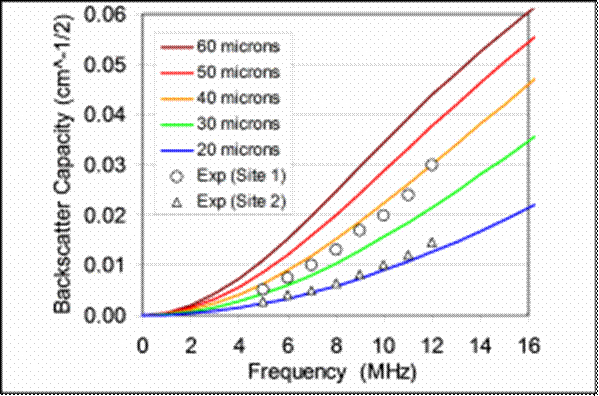
The noise models can be used in a variety of ways. From measured noise data one can deduce the Figure-of-Merit (FOM) describing the inherent noise generation capacity of the microstructure. This is a frequency-dependent property of the microstructure alone, and methods for measuring it have been developed at CNDE. For simple microstructures, FOM measurement can be used to deduce grain size and shape information. For example, the figure below shows predicted and measured curves of backscatter capacity (FOM) as functions of frequency for one Nickel alloy. The colored curves are predictions for microstructures having average grain diameters of 20, 30, 40, 50, and 60 microns respectively. The plotted points are measured values at two sites in a billet – there the grain diameters can be inferred as being approximately 20 microns and 40 microns, respectively.
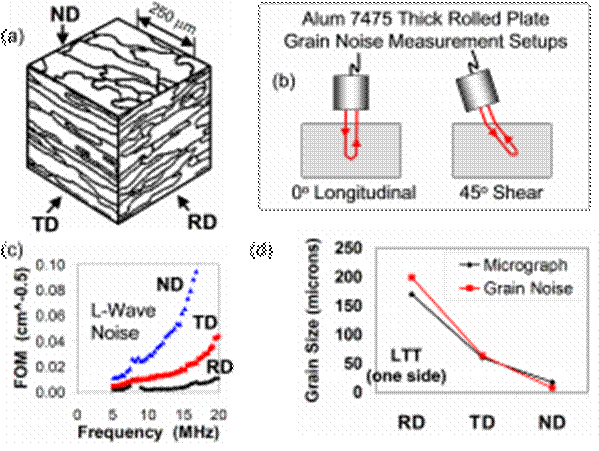
Another example of grain sizing is shown below. In this case the specimen is a 1.5”-thick plate of Aluminum alloy from a rolling mill. Panel (a) shows the microstructure as revealed by taking optical photographs and tracing the grain boundaries. Views are shown for the so-called “rolling”, “normal” and “transverse” directions of the plate. Roughly speaking, the grains resemble flat “pancakes” which are elongated in the rolling direction. Panel (b) of the figure depicts the UT grain noise measurement setups, one at normal incidence to measure backscatter using longitudinal sound waves, and one at oblique incidence to measure backscatter using shear waves. Panel (c) shows measured FOM curves for longitudinal waves for sound propagation in the three orthogonal directions. Finally, panel (d) compares average grain diameters measured in two ways: (1) from analysis of optical photographs (micrographs); and (2) inferred from the magnitude and directional dependence of backscattered grain noise.
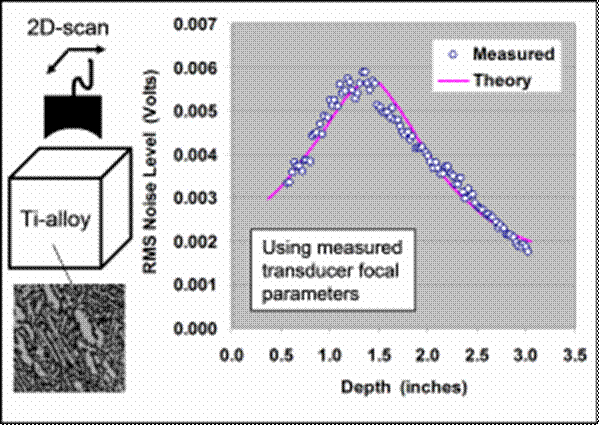
Alternatively, if the FOM is known for a microstructure of interest, the models can be used to predict absolute noise characteristics for a given inspection setup. This is demonstrate in the figure below. There a 5-MHz focused transducer was scanned above a block of jet-engine titanium alloy, and the average backscattered grain noise level was measured. The FOM of this specimen had been previously measured and was used to predict the result of the experiment. Good agreement was seen. As an aside, the first comparisons between model and experiment were not so favorable. It turned out that the transducer’s focal length as stated by the manufacturer was about 25% in error. By measuring the focal length ourselves and using that as an input to the model, much better agreement was achieved.
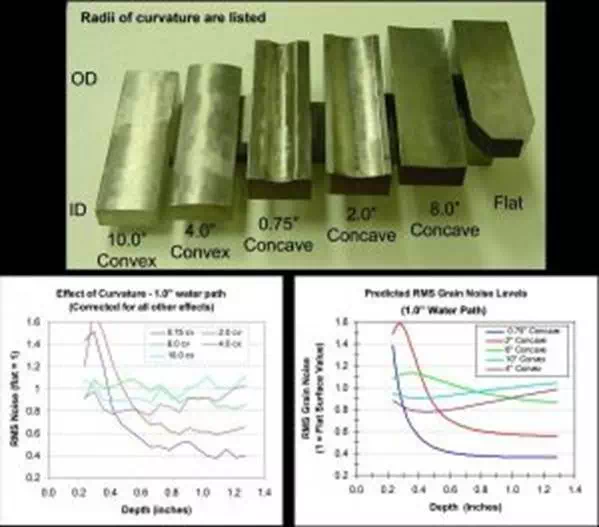
Another example comparing noise model predictions with experiment is illustrated below. The object here was to determine how surface curvature impacts grain noise levels. A 10-MHz spherically-focused transducer was used to inspect six specimens having similar microstructures but different surface curvatures. For each specimen, the transducer was scanned along the center line and the average grain noise level was measured as a function of signal arrival time (or equivalently of depth). All values were then normalized by the flat-surface result at the corresponding depth, so as to isolate the curvature effect. .Measured and predicted results are seen to be in very good agreement. Except in the near-surface region, the curvature tends to reduce the degree of beam focusing, thus in turn reducing the measured grain noise.
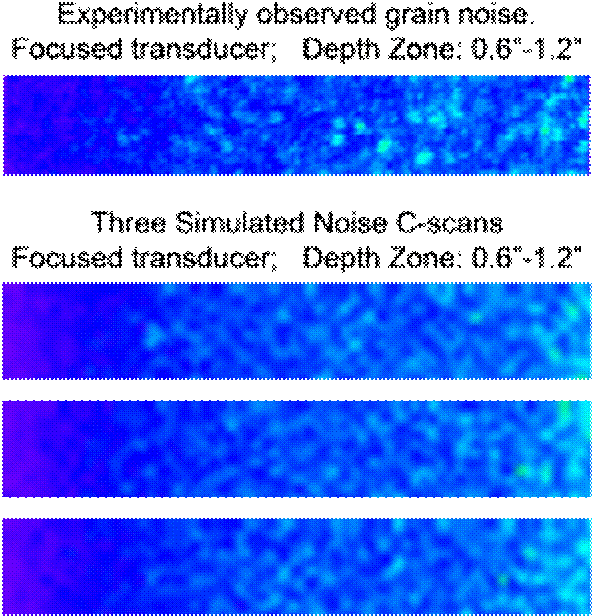
Below is yet another example of grain noise model predictions. In this case the objective was to predict the appearance of ultrasonic C-scans for a Ti-alloy specimen in which the microstructural varied with position. For model calculations of this type, average noise quantities are first predicted. Then random number generators are used to construct grain noise amplitude patterns (“speckle patterns”) which obey the predicted statistical averages.
By combining UT simulation models which predict flaw signals with those which predict grain noise signals, one can estimate S/N ratios for inspections of components containing hypothetical defects. Such comparative calculations can be used to zero in on the optimum inspection setup for meeting particular inspection goals.