Signal Filtering
Signal filtering is often used in eddy current testing to eliminate unwanted frequencies from the receiver signal. While the correct filter settings can significantly improve the visibility of a defect signal, incorrect settings can distort the signal presentation and even eliminate the defect signal completely. Therefore, it is important to understand the concept of signal filtering.
Filtering is applied to the received signal and, therefore, is not directly related to the probe drive frequency. This is most easily understood when picturing a time versus signal amplitude display. With this display mode, it is easy to see that the signal shape is dependent on the time or duration that the probe coil is sensing something. For example, if a surface probe is placed on the surface of conductor and rocked back and forth, it will produce a wave like signal. When the probe is rocked fast, the signal will have a higher frequency than when the probe is rocked slowly back and forth. The signal does not need a wavelike appearance to have frequency content and most eddy current signals will be composed of a large number of frequencies. Consider a probe that senses a notch for 1/60th of a second. In a period of one second the probe could (in theory) go over the notch 60 times, resulting in the notch signal having a frequency of 60 Hz. But, imposed on this same signal, could be the signal resulting from probe wobble, electronic noise, a conductivity shift and other factors which occur at different frequencies.
Filters Effects
The two standard filters found in most impedance plane display instruments are the ‘High Pass Filter’ (HPF) and ‘Low Pass Filter’ (LPF). Some instruments also have a‘Band Pass Filter’ (BPF), which is a combination high and low pass filter. Filters are adjusted in Hertz (Hz).
The HPF allows high frequencies to pass and filters out the low frequencies. The HPF is basically filtering out changes in the signal that occur over a significant period of time.
The LPF allows low frequency to pass and filters out the high frequency. In other words, all portions of the signal that change rapidly (have a high slope) are filtered, such as electronic noise.
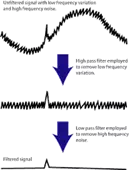
In the image above, the gradual (low frequency) changes were first filtered out with a HPF and then high frequency electronic noise was filtered with a LPF to leave a clearly visible flaw indication. It should also be noted that since flaw indication signals are comprised of multiple frequencies, both filters have a tendency to reduce the indication signal strength. Additionally, scan speed must be controlled when using filters. Scan over a flaw too slow and the HPF might filter out the flaw indication. Scan over the flaw too fast and the LPF might eliminate the flaw indication.
Filter Settings
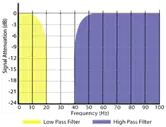
If the spectrum of the signal frequency and the signal amplitude or attenuation are plotted, the filter responses can be illustrated in graphical form. The image to the right shows the response of a LPF of 20Hz and a HPF of 40Hz. The LPF allows only the frequencies in yellow to pass and the HPF only allow those frequencies in the blue area to pass. Therefore, it can be seen that with these settings there are no frequencies that pass (i.e. the frequencies passed by the LPF are filtered out by the HPF and visa versa).
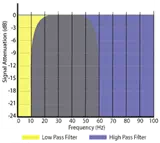 To create a window of acceptance for the signals, the filters need to
overlap. In the image to the right, the LPF has been adjusted to 60Hz and the HPF
to 10Hz. The area shown ingray is where the two frequencies overlap and
the signal is passed. A signal of 30Hz will get through at full amplitude,
while a signal of 15Hz will be attenuated by approximately 50%. All frequencies
above or below the gray area (the pass band) will be rejected by one
of the two filters.
To create a window of acceptance for the signals, the filters need to
overlap. In the image to the right, the LPF has been adjusted to 60Hz and the HPF
to 10Hz. The area shown ingray is where the two frequencies overlap and
the signal is passed. A signal of 30Hz will get through at full amplitude,
while a signal of 15Hz will be attenuated by approximately 50%. All frequencies
above or below the gray area (the pass band) will be rejected by one
of the two filters.
Use of Filters
The main function of the LPF is to remove high frequency interference noise. This noise can come from a variety of sources including the instrumentation and/or the probe itself. The noise appears as an unstable dot that produces jagged lines on the display as seen in the signal from a surface notch shown in the left image below. Lowering the LPF frequency will remove more of the higher frequencies from the signal and produce a cleaner signal as shown in the center image below. When using a LPF, it should be set to the highest frequency that produces a usable signal. To reduce noise in large surface or ring probes, it may be necessary to use a very low LPF setting (down to 10Hz). The lower the LPF setting, the slower the scanning speed must be and the more closely it must be controlled. The image on the right below shows a signal that has been clipped due to using a scan speed too fast for the selected HPF setting.
The HPF is used to eliminate low frequencies which are produced by slow changes, such as conductivity shift within a material, varying distance to an edge while scanning parallel to it, or out-of-round holes in fastener hole inspection. The HPF is useful when performing automated or semiautomatic scans to keep the signal from wandering too far from the null (balance) point. The most common application for the HPF is the inspection of fastener holes using a rotating scanner. As the scanner rotates at a constant RPM, the HPF can be adjusted to achieve the desired effect.
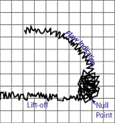
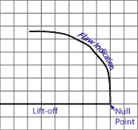
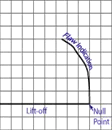
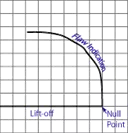
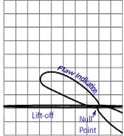
Use of the HPF when scanning manually is not recommended, as keeping a constant scanning speed is difficult, and the signal deforms and amplitude decreases. The size of a signal decreases as the scan speed decreases and a flaw indication can be eliminated completely if the scan is not done with sufficient speed. In the images below, it can be seen that a typical response from a surface notch in aluminum without HPF (left image) looks considerably different when the HPF is activated (right image). With the HPF, looping signals with a positive and similar negative deflection are produced on the impedance plane.
The use of a minimal HPF setting (1 or 2 Hz) may be used when manually scanning, provided the operator can largely control the scan speed and becomes familiar with the indication signal changes as scan speed is varied slightly. An good example of such an application would be the manual scan of the radius of a wheel that is rotated by hand, but the speed of rotation can be kept relatively constant.