Ledge Chart & Nav History
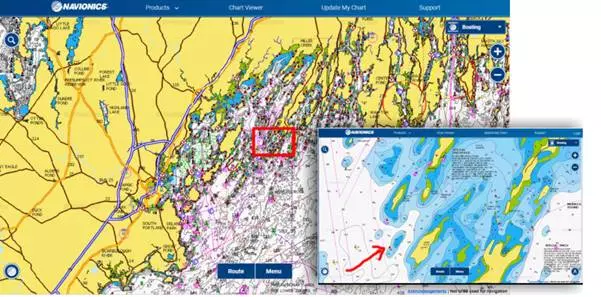
So let’s take a look at the chart history of the Crystal Bluesledge, which lurks in the southwest passage to Potts Harbor in Casco Bay. Again risking irony, the easiest way I know of to first get a good modern chart sense of the place is via this link to Navionics’ live and free Web chart.
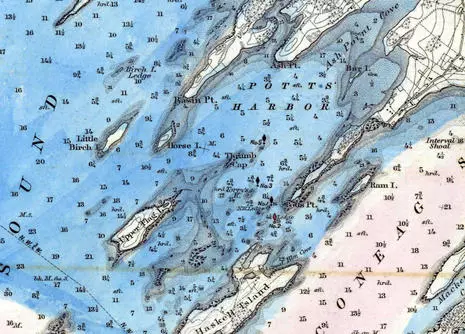
And here, thanks to NOAA’s Historical Chart Collection, is how Pott’s Harbor was charted on paper in 1870 at 1:40,000 scale (direct chart scan link here). The ledge northwest of Upper Flag Island was already known and looks very close in position to modern charts, though the survey seems to have gotten the ledge’s Mean Low Tide depth wrong at 6 feet instead of 3 (Maine ledges thankfully don’t tend to grow).
But I suspect that most 1870 sailors tried to stay well clear of ledges they might not even bump in most conditions, and that was relatively easy to do in this case because the nearby islands provide lots of good visual guidance for staying in deep water. By the way, the soundings on this chart are in Feet for depths up to 18 feet and then in Fathoms, which may have been confusing.
Also, note that the blue coloring was not normal in 1870. Instead, the particular chart scanned for NOAA’s Collection was hand colored for a project about the typical extent of winter ice formation. Unlike the ledges, winter saltwater ice in Maine has changed a lot.
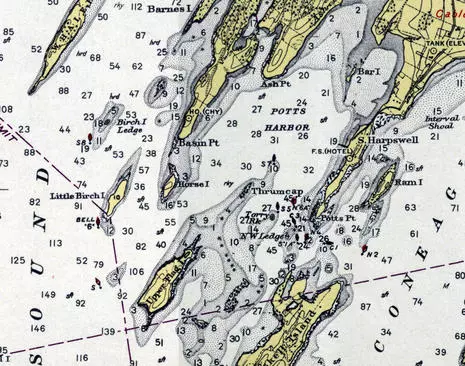
Now here’s a snip from the same 1:40,000 Casco Bay chart as printed in 1943 (direct link here). All soundings are now in feet and the Crystal Blues ledge is not only surveyed as only 3 feet at Mean Low Water but also guarded on its west side by a red and black buoy.
If you check the Navionics web chart viewer or the raster original via NOAA’s online viewer, you’ll see that red makes sense because the buoy is primarily a starboard hand mark for the main channel up Casco Bay. And I presume that the secondary black marking was because the same nav aid could be used as a port hand mark for boats headed up to Pott’s Harbor, though the USCG eventually changed their mind on that idea.
Besides the buoy as a visual aid, note how the cartographers included lots of onshore detail about further visual orientation. And, incidentally, this 1943 chart cost 75 cents, same as it did in 1870, even though NOAA had added helpful red and yellow inks to the print process.
The chart makers had even more colors to work with on this 1971 Casco Bay chart (direct link here), though the price had doubled to $1.50 (an ominous sign of the $27 paper chart price to come). The RB Nun had not been changed to RN “4” yet, but either way a navigator moving southwest out of Pott’s Harbor was responsible for figuring out that the dangerous ledge lay between their boat and the nav aid. Crystal Blues’ navigator Neil Langford admits to inattention in that regard, but let’s add an exclamation point!
Navigation aids are the visual marks — by eye or radar, and sometimes audible, too — that the USCG or similar authorities add to charted natural features as they find necessary for safe navigation. Consider the high cost of establishing and maintaining nav buoys, day beacons and so forth. So isn’t it folly for a navigator not to understand why each aid exists, what it’s trying to warn you about? The answers are often obvious, like marking a channel, but in complex topographies like the coast of Maine it can take some study. And just because a GPS can accurately and constantly plot your position on a chart doesn’t mean that you don’t have to “read” the chart carefully. Isn’t that the grounding’s lesson?