Computer-assisted groundings? Bad Navionics charts?
Despite incredible advances in chart availability and chart plotting, keels keep banging on reasonably well charted ledges and reefs all over the planet. Why? I’ve made far too many navigation errors to play the righteous scold, but I am taken aback by the tendency of boaters to blame technology and especially the recent trend toward castigating chart manufacturers like Navionics as if perfect data is a possibility or even an entitlement…
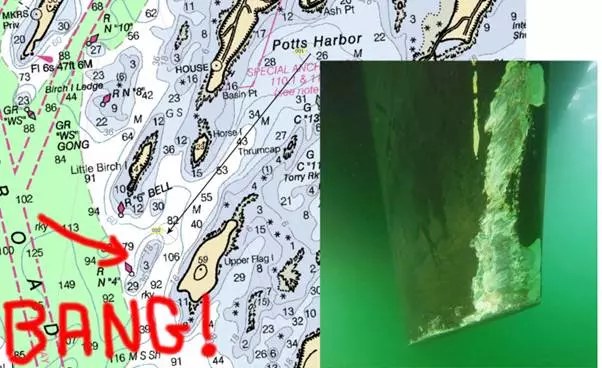
The damaged keel photo above comes from a cruising blog entry titled Navionics Sonar Charts & The Missing Reef, and my apologies in advance to Neil Langford for using his nicely written and illustrated accident analysis as a foil for my arguments about how we should be using electronic charts. In fact, Neil seems like an especially good debate opponent as he and and his partner Ley are deeply experienced sailors — 15 years and much of the globe in their wake — who have also worked hard at sharing information with fellow cruisers. Their site S/V Crystal Blues is enjoyable and valuable reading, and I’m hoping they’ll agree that our difference of opinion about their “computer-assisted grounding” is also educational.
Facts are not the issue. The Navionics errors that Neil reports were 100% true — I’m using the past tense because Navionics has already corrected them, thanks to Neil’s input — which I was able to verify myself using iPad charts that hadn’t been updated yet.
The worst error in my opinion was that the regular Navionics chart (inset lower right above) did not show the 3-foot depth sounding clearly shown on the official NOAA raster chart at top, as well as the NOAA vector chart in the background above, even though Navionics bases its regular charts on the same NOAA data (like all the cartography manufacturers do). But here’s another fact: Every vector chart I’ve ever used, including NOAA’s, sometimes misrepresents significant depth soundings that are prominently marked on the equivalent (paper-like) raster charts (that are largely drawn by human cartographers, not algorithms).
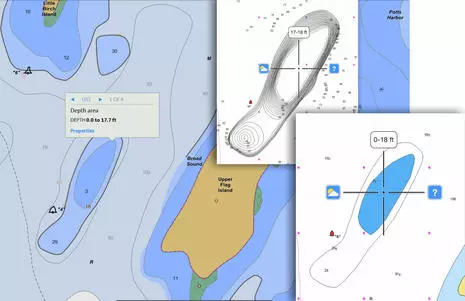
However, Neil’s main complaint concerns Navionics SonarCharts, first how the 3-foot ledge was missing and then how many other errors he subsequently found, at least in comparison to official data. Holy cow, as much as I appreciate SonarCharts, I’ve never even considered using them for primary navigation! As discussed here, I love the ability to share depth information with other boaters, but I also regard SonarChart data with what seems like appropriate skepticism. I expect to see more mistakes on non-official charts like this, and I don’t expect perfection on any chart.
I was further surprised when Neil reported that fellow Ocean Cruising Club members “were using the SonarCharts when navigating in harbors, as they valued the extra detail provided, and were shocked to hear of our collision.” Dang, the OCC is an experience-based club largely dedicated to sharing accurate up-to-date cruising information — why I was proud to become a member — but “extra detail” is not necessarily extra accurate, or even vaguely correct. Isn’t it obvious that SonarCharts are based on depth data collected from boaters and other non-official sources, and thus best used alongside depth data at least originally vetted by hydrographic offices?
Apparently not, and Neil fairly points out how much Navionics brags about SonarChart detail in its marketing. But then again, SonarCharts are always packaged along with regular Navionics charts, and the Navionics Boating app he was using also offers a third “Government” chart choice in the U.S. (which did show the 3-foot sounding). In the app you can flip from one chart type to another with a finger tap, and on a MFD you can window SonarCharts side by side with what Navionics sometimes calls their Nautical Charts.
Neil also points out that his Raymarine chartplotter prominently marks SonarCharts as “Not for Navigation,” but then goes on to argue, “If I can’t use them for navigation, what will I actually do with these SonarCharts?” Well, sorry, but that’s a sailor oblivious to the fact that a huge segment of chart users are fishermen who are very interested in bathymetry detail for finding spots where fish lurk, a use where data mistakes don’t often lead to surprise keel groundings.
Perhaps ironically, excellent guidance on the proper use of electronics charts can be found on the Navionics blog. I recommend a thorough reading, but here are some key quotes with my boldfacing:
No single tool replaces the necessary use of sound judgement and proper seamanship. Most boaters employ the good practice of consulting multiple chart sources and regularly updating cartography, while each has its benefits and limitations. Proper understanding of an electronic chart is just as important as vessel maintenance and operation. In fact, reliance on electronic charts should never be done blindly since all charts have errors (official hydrographic office, government, private, or other).
The GPS available on boats is equivalent to the GPS on cars and light aircraft: meant to be used for visual orientation while driving, possibly with the aid of other instruments like sonar and radar, and cross checking every possible source of information. The nautical chart, whether paper or electronic, is not designed and built for instrument navigation, but for orienting visual navigation. The warnings that go with all charts are not there to protect the chart makers, but rather to protect the chart users from making mistakes in over-reliance on any one tool of navigation.
I like to think that many boaters already use “multiple chart sources,” but how about the notion that charts are designed for “orienting visual navigation” instead of just the constant GPS plotting so many of us tend to use exclusively? For me that’s a new way of expressing a concept I’ve long held, and also a prinicipal that fits neatly into the history of charts.