Engineering Tools for the Estimation of Dredging-Induced Sediment Resuspension and Coastal Environmental Management
Dredging activities are widely used in estuarine and coastal areas to maintain or improve the designed depth of navigation channels or basins (i.e. ports and harbours), for the creation or the improvement of facilities, for beach nourishment and to carefully remove and relocate contaminated materials (i.e. remedial or environmental dredging). These activities generally involve processes of removing materials from the bottom and relocating them elsewhere. Some of the sediments removed from the bottom are not captured by the dredge-head movement as part of the dredging operation, and thus the fine-grained fraction of resuspended sediments is dispersed in the water column ([1]). Furthermore, in the case of environmental dredging, some of the contaminated sediment may be left on the bottom as "no dredging operation can remove every particle of contaminated sediment"([2]). In recent years, increasing attention has been paid to the environmental impact due to the dredging activities and to reduce any physical, chemical and biological changes related to the sediment resuspension and pollutants (if any) dispersion (e.g. [2–5]). Four issues relevant to environmental dredging (the so-called four R's) were recognized ([2,6]): sediment resuspension, contaminants release, residual contaminated sediment produced by and/or remaining after dredging and environmental risk. We focus on the first R herein, i.e. the resuspension of dredged sediments. Indeed, the increase in the suspended solid concentration (hereinafter referred to as SSC) and the subsequent resettling of sediments transported as a dredging plume can bring adverse impacts on water quality (i.e. pollutants and nutrient dispersion, dissolved oxygen sags), on aquatic ecosystem (i.e. limiting of the photosynthetic process, smothering on the gills of bivalves or fish, inability to detect predators) and on human health (e.g. [7–9]).
The assessment of environmental effects and risk exposure to the turbidity extent of dredging plumes always requires site-specific evaluations and should take into account the natural variability of local background turbidity ([10,11]). Hence, the magnitude of resuspension due to dredging should be placed in context with other sediment resuspension events or sources (i.e. river flow, the overflow from a barge, vessel traffic, etc.) and carefully managed. Establishing quantifiable tolerance limits for increase in turbidity and chemicals concentration (if any) is thus complex, while it is critical for the assessment of environmental impacts that may result from the dispersion and resettling processes of resuspended sediments. Hence, both monitoring and modelling data should be preliminary stated in order to provide control parameters useful for subsequent monitoring and management plan during the execution of dredging activities ([12,13]). Meaningful criteria to limit environmental impacts related to the extension of dredging plumes require the estimation of the SSC at the dredging source, and thus the definition of its source strength (i.e. the mass of resuspended sediment per unit time at the dredging point) and geometry ([14]). The resuspended rate (or sediment loss rate) close to dredging sources and the spatial and temporal variability of resulting plumes can significantly vary based on site and operational parameters, such as: sediment properties (i.e. bulk density, grain size, mineralogy), environmental (i.e. dredging water depth, thermoaline stratification, currents) and operational (i.e. dredging type, production rate, thickness of dredge cuts, velocity of dredging cycle) conditions (e.g. [1,6,14–17]). The resuspended sediment can be released from dredges by a wide range of mechanisms and at different levels in the water column and the resulting plumes are complex in terms of spatial distribution and time evolution. Understanding how different dredging types can operate is thus essential to provide standard methods for assessing increase in SSC and other adverse effects that may result from resuspension, sedimentation and increase in concentration of chemicals (e.g. [2,3,18,19]). Usually, three phases are identified for the dredging plume development at different distances from the dredging location ([2,3]): the dredging zone; the near field zone; and the far field zone (or passive plume).
The starting phase of the plume dynamic is strongly dependent on the temporal and spatial variation of the source strength (expressed as concentration by weight) and geometry at the dredging zone. The dredging zone is usually small (approximately few meters around the moving dredge-head equipment). Within this zone, the grain size distribution and the mass flux of SSC entering into the near field are relatively uniform and mainly affected by selected operational conditions. Subsequently, SSC are subjected to differential settling during the plume development (i.e. the coarser particles settle faster than the finer particles) and only the finer fraction moves out from the near field to the far field zone. The plume behaviour becomes reasonably predictable and quantifiable at the edge of the dredging zone. Generally, the plume passes from the dredging zone into the near field over a timescale of seconds and a distance of few meters, while the far field transition occurs (over a time scale ranging from minutes to hours) within few hundreds of meters far from the dredging location ([2,3,6]). Within the far field zone, the plume dynamic is mainly driven by environmental conditions in which dredging takes place and resulting dispersion and settling processes are of the same order of magnitude. Consequently, oceanographic features, hydrodynamic conditions and background SSC (or turbidity) levels are all important factors in determining the plume extension. Depending on the plume dynamic in the far field, there can be significant spatial and temporal variations of the SSC distribution and of the related environmental effects ([13]).
Tighter control in the form of strict regulations, proper enforcement on monitoring and mitigating measures can help to prevent, at least to minimize, the adverse environmental impacts ([10]). However, relying both on mathematical modelling and on field measurements, appropriate management and monitoring measures can be designed before the dredging execution and the dredging plan may be optimized to achieve the environmental objectives while maintaining desired production rates ([20]). Well-established international guidelines and past researches aimed at supporting environmental studies for projects that involve the handling of sediments are now available. Most of these include the use of numerical modelling as a valuable tool ([13,21–26]) to predict the area interested by SSC increase. Different models are currently used to investigate advection and dispersion phenomena of any substances (i.e. sediment and pollutants) and their effects on the water quality and ecological processes (i.e. larval dispersion, nutrient level) with respect to different environmental windows (e.g. storm or low-frequency flood event and seasonal or annual scenarios, i.e. [27–31]). In particular, source models are especially developed for estimating the source strength and the SSC moving out the dredging zone for different site and operational conditions (e.g. [14–17,32–34]). Then, near field and far field numerical models are commonly used for quantitatively estimating the planar and vertical extension of the plume dynamics close to (near field models) and far from the resuspension sources (far field models, e.g. [35–40]). As already pointed out, depending on the variability of site and operational conditions, the resuspended rate at dredging sources and the subsequent overall sediment transport can significantly vary (in terms of magnitude, duration and location of the induced SSC) during the execution of dredging projects. Thus, to be truly effective as a dredging project management tool, models should be capable of running starting from different dredging sources (i.e. continuous or time varying sources) also imposed as initial conditions. This allows the evaluation of a number of alternative dredging scenarios so that those with the least probabilities of detrimental impacts with respect to different environmental site conditions can be determined. Despite the attention that has been focused on this issue, there is a lack of verified predictive tools of dredging plumes usable for environmental and management purposes ([41]).
In this contest, the development and the application of models to estimate the sediment loss rate from different hydraulic and mechanical dredges is one of the most important efforts to address this wide-ranging and complex problem (e.g. [14,15,17]). This chapter aims at providing a general insight about the problem of sediment plumes arising from dredging activities. In particular, the available predictive techniques aimed to estimate the near field SSC induced by different dredging sources are detailed. Then, a novel one-dimensional analytical model is proposed to provide a fast order of magnitude of the plume dynamic when time-varying sources and time-varying currents have to be considered. Moreover, an integrated and replicable numerical suite, combining a series of numerical tools, is proposed to support the design phase of a dredging project and environmental studies in coastal and estuarine areas (especially in semi-enclosed basin). The proposed integrated numerical approach, within which empirical formulations based on field and experimental observations are used as forcing terms of mathematical models, is applied to the Augusta Harbour (Eastern coast of Sicily Island – Italy) case study. Results, obtained for different hypothetical dredging activities, show hydrodynamics and induced SSC dispersion features and thus the ability to support technical choices during planning and operational phases.
Dredging techniques and mechanisms of sediment resuspension
"Dredging" is a general term covering a wide variety of activities. A review of dredging applications reveals three main groups of dredging works: (1) capital dredging involves the creation of new or improved facilities (i.e. harbour basins, deeper navigation channels, area of reclaimed land) for industrial or residential purposes; (2) maintenance dredging concerns the removal of siltation from the bottom of navigation channels and ports in order to maintain the designed depth and (3) environmental or remedial dredging requires the careful removal of the contaminated material, and it is often linked to the further treatment, reuse or relocation of such sediments. With regards to the working principles for processes of removing sediments, dredges may be categorized into two broad categories: mechanical and hydraulic dredges (i.e. [42,43]). The selection of the most appropriate equipment and method to perform dredging depends on different environmental factors, e.g. volume, physical and geotechnical features of the sediment to be removed, the presence of contaminants at different depths of the bottom layers, the dredging depth and the distance to the disposal area. SSC levels of the resuspended sediment along the water column depend on the complex interaction between these environmental factors and different mechanisms of sediment resuspension from specific dredging techniques. The most commonly used mechanical and hydraulic dredges are described in the following, by pointing out the main sediments resuspension mechanisms that may occur during the excavation of material for different dredging equipment.
The description of dredges presented in this section is mainly adapted from [42] and [43]. Mechanical dredges make use of mechanical excavation equipment for cutting the bottom and raising material. The material is picked up by mechanical excavators mounted on a pontoon kept in fixed position into the seabed and placed in disposal areas. When the disposal area is too far from the dredge site, the sediments is transported by a barge. These dredges may be used to excavate most types of materials but for the most cohesive consolidated sediments and solid rock. The most common mechanical dredges are the grab- (or clamshell) dredge (GD), basically a conventional cable crane, and backhoe- (or dipper) dredge (BHD), basically a conventional hydraulic excavator (Figure 1). These dredges types move by using anchors, spud carriage systems or by a tug for significant distances, and are typically used in both capital and maintenance projects. They are typically used in areas where hydraulic dredges cannot work (particularly around docks and piers or within other restricted areas), or where the disposal area is too far from the dredging site. The excavating system has to be repositioned at every cycle. The dredging process can be controlled accurately (e.g. [44]), since it is used extensively for removing relatively small volumes of material (i.e. a few tens or hundreds of thousands of cubic meters) particularly within other restricted areas. Production rates are low if compared to the hydraulic dredges and it is highly dependent on the operator’s skill. Up to 500 m3/hr can be achieved with the largest backhoe dredges.
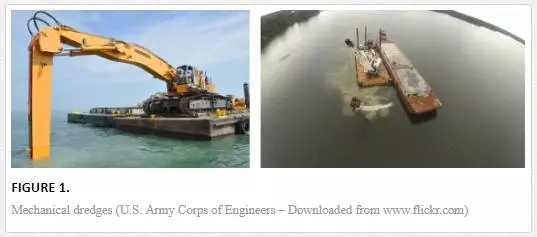
The dredge begins the digging operation by dropping the bucket in an open position from a point above the water. The bucket penetrates into the bottom material and the material is sheared from the bottom and contained in the bucket compartment. The sediment is removed nearly at its in situ density. Conventional mechanical dredges resuspend sediment when the bucket hits the seabed, when the hoisting turbulence washes away part of the load and because of spillage as the bucket is lifted or lowered through the water column. Moreover, significant amounts of suspended sediment can be released when its contents are loaded into a barge. For mechanical dredges, sediment resuspension concentrations can be significantly affected by different operative parameters, such as bucket overfilling, over-penetration, bucket speed when contacting bottom and bucket speed when lifting bucket off bottom. Hence operator controls can be utilized in order to reduce sediments resuspension. Loss of loose and fine sediments is generally influenced by the fit and condition of the bucket, the hoisting speed and the properties of the sediment. Then, variations of the jaw grab dredge design have been developed in recent years to minimize loss of sediment and allow better precision. In particular, special watertight buckets, collectively referred to as “environmental” buckets, are used in contaminated sediments to minimize the turbidity generated during dredging operations. Generally, the “environmental” buckets move along a horizontal profiling by removing thin layers of sediments in order to achieve high accuracy. The horizontal profiling allows the filling of the bucket with low water content. Furthermore, "environmental” buckets can have other features such as one-way vents in the top of the dredge to reduce downward pressure during deployment and rubber seals to prevent loss of sediments deployed in order to further reduce sediment resuspension.
Hydraulic dredges pump the dislodged sediment as a mixture of water and sediment. The dilution of excavated materials, typically with 5–30% of solids content, can vary significantly depending upon the soil type and the attainable layer thickness. The loosened sediment is pumped via a pipeline to the desired location (disposal area), or uncommonly loaded into a barge, making use of centrifugal pumps for the transport processes (raising and horizontal transport) installed on the floating pontoon. Hence, hydraulics dredges operate on an almost continuous dredging cycle and they are suitable for maintaining harbours, canals and outlet channels, when the removed material has to be pumped ashore (e.g. for reclamation) or for long distances to upland disposal areas. Depending on the size of the suction dredge and the characteristics of the excavated material, the output rate can vary widely, from 50 to 5,000 m3/hr. The most common types of hydraulic dredges used in coastal water are stationary- (SD) and cutter- (CSD) suction dredges based on the breaking up system of the mass of sediment (Figure 2).
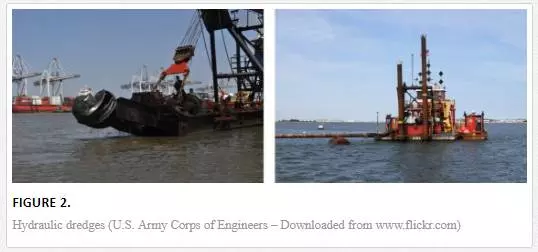
Stationary suction dredger (SD) is the simplest type of hydraulic dredge. The suction pipe is lowered into the sea bottom and seabed material is sucked up by suction action of the dredge pump which is often mounted on the suction ladder. Only relatively loosely packed granular material or silt can be dredged with this equipment. Water is added to the removed sediments for transportation purposes. The application of water jet near the suction pipe can improve excavation efficiency. Generally, the amount of suspended sediment close to the suction mouth depends on the difference between jet-flow and suction-flow. The suction dredge has the disadvantages that considerable resuspension is possible due to relatively uncontrolled process of applying suction. Furthermore, accurate dredging is not possible, due to the relatively uncontrolled production process by suction. Hence, the suction dredge is less suitable for selective dredging. Improved precision can be achieved only by using specific operating precautions (in the order of 1.0 m up to 10 cm), e.g. when the suction entrance is modified by installing a wide and flat head, such as in the so-called Dustpan Dredge. Cutter suction dredge (CSD) is an efficient and versatile sediment mover commonly used in both large and small dredging projects. It makes use of different types of rotating cutterhead (or breaking up system) mounted at the end of a suction pipeline to dislodge a wide range of seabed materials, including clay, silt, sand, gravel, stiffer cohesive sediments and soft rock (such as softer types of basalt and limestone).
During operation, the cutterhead dredge swings from side to side alternately using the port and starboard spuds as a pivot. Good dredging location accuracy may be achieved because the movement of the dredging-head is controlled from a fixed point (the working spud). Cables attached to anchors on each side of the dredge allow the control of lateral movements. Sediment resuspension induced by hydraulic dredges shows relatively simple physics. The main sediment resuspension is due to the disturbance of the seabed around the dredge-head, because not all dislodged sediments are entrained into the suction pipe line (e.g. [34]). The transport of the dredged material from the bottom to the surface is fully enclosed into the suction pipe, then, unless there is leakage of pipelines, there should be no sediment losses. Significant sediment release can also occur during the loading phases into the dredge or into barges, due to overflow or to possible leakage from the barge of the pumped sediments as a highly diluted mixture. Compared with most other hydraulic dredges, the rate of sediment resuspension from cutter suction dredges is expected to be relatively constant during the main part of the swing (especially when homogeneous materials must be removed). As the dredge approaches the end of the swing, it slows down and the sediment resuspension rate may be reduced (e.g. [3]). Different operating conditions such as: cutterhead rotation, swing speed, pump rate, bank height, water depth, shape of the cutterhead, thickness and cut direction (particularly if no over-depth is allowed) can also affect the resuspended sediment that leaves the dredging zone (the turbulent zone around the ladder and the cutter-head action). In particular, low production rates and shallow cuts for hydraulic dredges can increase resuspension.
However, the high production rate may increase the resuspension when currents and wave energy are high because more sediment can be dislodged and captured by the dredge head. According to [1], the increase of SSC induced by dredging operations does not only depend on the employed dredging techniques, either mechanical or hydraulic, but can also be related to the geotechnical property and the water content of the dredged sediment (i.e. liquidity, density, porosity or void ratio, plasticity and nature of a fine-grained soil). In particular, very soupy sediments resuspend more easily and effects related to SSC are larger for sediments with higher liquidity. Generally, silts are more liquid than clays at the same water content, while the liquidity increases with a decrease in the plasticity index of the sediment. Moreover, an increase in obstacles to normal dredging, such as debris, cobbles, boulders, bedrock and rock outcroppings, may result in an increase in resuspension. Of these obstacles, debris poses the greatest problem to resuspension when mechanical dredges are used. Indeed, debris can prevent closure or seal of the clamshell, causing significant leakage or loss of dredged material to the water column. Debris can also disrupt the capture of sediment by cutter head dredges and increase dispersion of the dislodged sediments. Then, the separate removal operation of impediments can resuspend nearly as much sediment as the dredging operation as well as increasing the liquidity of the material for subsequent dredging. As already outlined for mechanical dredges, specific operating precautions can now successfully be used to minimize the sediment resuspension due to “conventional” dredges and a series of newer “environmental” dredges are specifically designed to careful remove contaminated materials with respect to reductions in resuspension (and release), and operational efficiency for removal and transportation (e.g. [12,42]). Resuspension can be minimized using specific operating precautions, by proper equipment selection, modifying equipment and operation techniques or by containment of resuspended sediment such as silt curtains or screens. Equipment selection is sometimes limited by availability, but operational controls can be considered for a wide range of equipment types. The reader is referred also to [12,42,46] for more details on the commonly used "environmental" dredges types and environmental operating precautions.
Resuspension dredging source formulations
The assessment of environmental impacts related to the exposure of sediment plume resulting from dredging activities requires the estimation of the near field re-suspended sediment concentrations (SSC, kg/m3) moving out the dredging zone (i.e. dredging source). Few conceptual models to predict the resuspended sediment mass rate at the dredging point, and thus its source strength and geometry, as a function of different site (i.e. sediment properties, water depth, currents) and dredge-operating (i.e. dredge type, dredge-head dimension) parameters were developed by e.g. [14–16,32–34,47]. Considerable resuspended sediment field data were collected in the vicinity of various hydraulic and mechanical dredging projects to develop these models. However, since the used data sets cover a relatively narrow set of site and operational conditions, the proposed formulations have limited predictive values and require specific adjustments to serve as predictive tools of SSC for different dredging projects. Typical resuspension rates have been reported in [45] and [15]. As highlighted by [19], the resuspended source induced by dredging may be defined by the estimation of the SSC (mg/l) moving out the dredging zone, by the sediment loss rate (kg/s) in the water column, or by the total mass of resuspended sediment expressed as a fraction of the dredging production rate (kg/m3). The concept of the sediment flux across the sources boundaries can also be used (e.g. [18]). The available conceptual methods for estimating the sediment resuspension induced by different (i.e. hydraulic and mechanical) dredging sources are reported in the following. Such formulae are divided in "basic formulations", which are based on the use of tabular data, and "empirical formulations" containing a set of dimensionless parameters related to operating and site characteristics.
BASIC FORMULATIONS
Ref. [16] introduced the turbidity generation unit (TGU) concept. It corresponds to the unit of suspended sediment or turbidity (kg/m3) generated if a unit of quantity of bottom sediment will be dredged. In Nakai’s formulation ([16]), the TGU (kg/m3) is expressed as a function of the total quantity of resuspended sediments generated by dredging (W0, kg) and the total quantity of dredged materials (Qs, in m3):

where the coefficient K is given by the ratio (R74/R0) of the fraction (by weight) of sediments smaller than 74 μm (R74) and the fraction of sediments smaller than the particles whose critical resuspension velocity equals to the local current velocity (R0). The variable W0 strongly depends upon the specific dredging operation, thus equation (1) can be rewritten as follows

where C is a coefficient depending upon dredge type (and thus sediment characteristics) and ρ is the specific weight of dredged sediments (kg/m3). Equations (1) and (2) give the turbidity generated by a unit of dredged sediment. It may be observed that Nakai’s formulation assumes uniform vertical and horizontal sediment distributions in the water column and a constant and unidirectional velocity. The W0 was estimated by field data of suspended sediment collected down-drift (30–50 m) the dredging area for different dredging projects. After these measurements, Nakai used a simple relationship to infer the total mass of turbidity (or suspended sediments) arising from the dredge:

where Cr (Kg/m3)
is the measured net SSC generated by dredging; A is the cross
section of the turbid area (m2), obtained by multiplying its width (m)
and the water depth (m); and u is the mean tidal current
velocity (m/s). Nakai rewrote equation (1) in the appropriate form in order to define the dredging
source in term of resuspended rate (or sediment loss rate), redefining W0 as
the turbidity generation rate (kg/s) and Qs as the
sediment removal rate ((m3/s)
In particular, equation (4) allows estimating the total quantity of the turbidity generated by dredging (W0) when TGU values, sediment removal rate (Qs) and characteristics of dredged sediments (R74 e R0) are known. It could be useful to note that the term Qs R0 represents the removed sediment mass per unit time (m3/s) with a sediment settling velocity sufficiently low to stay in suspension for a long time. Then, it is quite clear that the implementation of Nakai’s formulation as predictive tool requires the knowledge of TGU values, depending upon the dredging technique. TGU values estimated for different site and operational conditions are reported in [16], along with values of critical resuspension velocities estimated for different sediment size and type of dredged sediments. The Nakai's TGU values were integrated by [17] with their "suspension parameter" (similar to TGU definition) on the basis of further SSC field measurements. Although the TGU method is now commonly used for open clamshell, cutterhead and hopper dredges, it has significant application limitations. Indeed, there are a relative small number of SSC data (i.e. collected for different sediments and equipment) used to derive the TGU values and information on key sites and operational descriptors related to dredging method and techniques are lacking. Moreover, some inconsistencies may occur because TGU formulation is derived only for unidirectional currents and it does not include the SSC due to the overflow during the loading phases (especially for hydraulic dredges). Inconsistencies can also be derived by the basic assumption used to infer TGU values that all particles > 5 µm resettle in the vicinity of the dredge. In particular, recent SSC measurements showed that a considerable fraction of particles ranging from 20 µm up to 30 µm can leave the near field zone ([1]).
Thus, according to [1], a considerable overestimation of the multiplier (R74/R0), especially when sediments with low clay fractions are removed, can lead to an overestimation of the TGU values. In particular, [15] stated that inconsistencies of the TGU method can be related to the R74 parameter that could lead to an erroneous estimation of resuspended sediments. Indeed, an increase in the sediment fraction smaller than 74 μm (and thus a reduction of the ratio 1/R74in equation 4) leads to a non-physical decrease in the estimated resuspended loss rate. Nevertheless, TGU method can be considered inconsistent only when comparable changes of R0 and R74 parameters simultaneously occur. To overcome such application limitations, [34] and [15] introduced the resuspension factor (R). It is defined as the mass of resuspended sediments relative to the total mass of dredged sediments (expressed as percentage):

where g is the predicted rate of resuspended sediment leaving the near field zone for a specific dredging operation (in g/s), Vs is the volumetric rate of in situ removal sediment (m3/h), Cs is the in situ sediment concentration (kg/m3) and R74 is the fraction of sediments smaller than 74 μm leaving the near field, or smaller than the largest sediment size subject to far field transport. A series of values of R values are reported in [15,34] for different dredging operations covering a variety of conditions. However, since resuspension factor model has been developed on the basis of a limited number of data set, resulting ranges of estimated R values have shown a high variability for the different examined dredging techniques.
PARAMETRIC FORMULATIONS
Empirical formulations, developed for estimating resuspended sediment and its source strength, relate non-dimensional variable groups of dredge operating parameters to SSC observed for different operational (dredge type, dredge-head dimension, controllable aspects of dredge operation, etc.) and site conditions (sediment type and grain size, water depth and local hydrodynamics conditions, etc.). These formulations solve some of the application limitations of the TGU and resuspension factor models, based on tabular approach. Empirical models to estimate the SSC of the released sediment moving out from the dredging zone into the far field, and its associated source strength and geometry, were developed by [14,24,33,47] only for clamshell (open and enclosed) and cutterhead dredges. Ref. [33] proposed a relationship between the net concentrations of resuspended sediments Cr (kg/m3) induced by cutterhead dredges and two dimensionless groups related to “kinematic” operating parameters:

where Vs is the swing velocity at the tip of the cutter (m/s), Vi is the suction intake velocity at the cutter blades, Vt is the tangential velocity of the cutter blades at the top of the rotation relative to the surrounding water (m/s). It has to be stressed that the tangential velocity Vt is relative to the surrounding water, then it depends on the swing velocity and on the direction of the swing (i.e. either starboard-to-board or board-to-starboard, Vt = |Vs±Vc|, being Vc the tangential velocity of the rotation of the cutter blades). The relationship (6) was obtained on the basis of Calumet Harbour dredging project ([48]) during which only one cut thickness was used, being roughly equal to the cutter diameter (i.e. mud-line full penetration as defined by [14]). Then, the cut thickness parameter was not considered in the analysis and any dimensionless group related to the used cut thickness. Ref. [14] confirmed the results of [33] and performed a similar regression analysis, including more SSC data from other dredging sites (i.e. Savannah River and James River in addition to Calumet Harbor) by including further dredge sizes, operating parameters and sediment characteristic (e.g. [15]). Indeed, in addition to operating kinematic parameters (i.e. Vi, Vt, Vs), [14] also included geometric operating parameters (e.g. length of cutterhead, L, diameter of the cutterhead, Dch, and the degree of cutterhead penetration, D) and the sediment mean grain size (d). Ref. [14] proposed to use the same approach of [33] by considering the influence on the first coefficient (i.e. 1.150 in eq. 6) of the cut thickness. In particular, in the Collin's regression analysis ([14]), the net SSC (Cr, in kg/m3) is estimated as:

where the SSC concentration is related to the density of water above mud-line (ρ, g/m3), to the same cinematic parameters (Vs, Vi and Vt) proposed by [33] and where FF and FD are dimensionless parameters aimed at describing the influence of cut thickness upon SSC concentration. Indeed, FF (full cut parameter) accounts for the cutter size (characteristic size of cutterhead, L) and the median grain diameters (d):
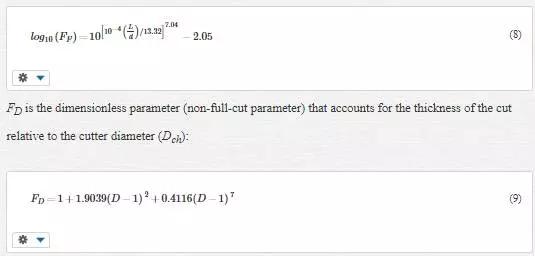
where dimensionless parameter D (=df/Df) is the ratio of the actual cut depth with respect to the mud-line (df) and the full cut depth (Df), hence representing buried (D>1), partial (D<1) and full (D=1) cutting. Then, FD is equal to 1 for full cut dredging, while FD is greater than 1 for both partial and buried cutting. The relationship providing full cut parameter (FF) was developed as a function of dimensionless sediment grain size alone as other parameters, such as water depth, did not changed for full cut dredging project used to perform the regression analysis. It has to be stressed that, on one hand, the full cut parameter does not take into account the cutting mode and, on the other hand, the non-full-cut parameter (FD) takes into account the differences between types of cutting modes.
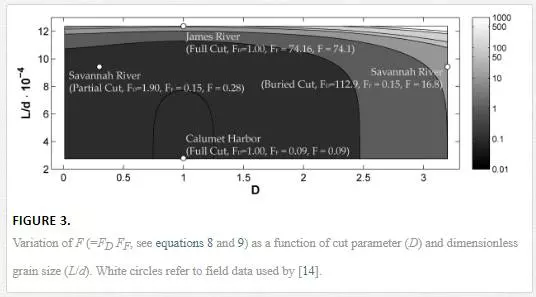
It could be noted that also the non-full-cut parameter may depend upon the dimensionless sediment diameter. Nevertheless, non-full-cut dredging was performed during only one project (i.e. Savannah River), then L/d parameter was constant and such dependence cannot be identified, even if it exists ([14]). Figure 3 shows the estimated values of F (=FD FF) as a function of dimensionless dredged grain diameter (L/d) and of dimensionless cut parameter (D) along with the points indicating the field data used by [14] to define relationships (7), (8) and (9). It could be noted that, obviously, the lower the grain size, the higher the SSC concentration. As far as the buried cut is concerned, it could be observed that the SSC concentration rapidly increases as the sediment above the cutter head tends to fall and slough and the suction pipe may not be able to remove it, then an increase in the resuspended sediment concentration occurs ([14]). When partial cut is considered, the SSC concentration slightly increases due to the increased exposition of the cutter head blades to wash-off phenomena, if compared to the full cut configuration ([14]). Ref. [34] analyzed field data collected during cutterhead dredging project performed in the James River, Savannah River, Calumet River and the Acushnet River, for a total of 106 observations, and proposed two different empirical models aimed at predicting the rate of sediment resuspended by the dredge (g) as a percentage of the total dredged sediment. These models are based on the hypothesis that the majority of the resuspended sediment arising from the dredge-head is due to the wash off phenomena occurring at the cutter blades that pass through the water after they have passed through the sediments. Hence, the sediment particles that adhere to the blades are washed into the water column and, if the sediment grain size is small enough, are dispersed to the far field. Ref. [34] proposed a first "dimensional" model by using stepwise linear regression aimed at catching empirical relationships between the involved operating parameters, such as the swing velocity, the angular velocity of the cutterhead, the surface of the blades exposed to wash-off, etc., and the rate of resuspended sediments:

where g (%) is the predicted rate of resuspended sediment and transported away from the dredging site as a percentage of the sediment mass dredged, AE is the total surface area of cutter blades exposed to washing ([32]), Vs is the swing velocity at the tip of the cutter (m/s); Cs in situ sediment concentration (kg/m3), tc is the thickness of cut (m), L is the length of the cutterhead (m), dc the cutter diameter and βthe cutter rotational speed (rps). Moreover, [34] proposed a "non-dimensional" model based on the definition of a series of dimensionless variable groups. Even if conceptually similar, [34] found a different relationship:

where Q is the volumetric dredge production (m3/s). Ref. [34] did not clearly indicate which of the two models is superior to the other by using the standard statistical parameter used to evaluate the models' skill. However, they found that the non-dimensional model given by equation (11) is better if compared to dimensional model given by equation (10). Furthermore, [34] stated that the models application outside the validity range may lead to very high, i.e. conservative, estimates. As far as mechanical dredging is concerned (i.e. open and enclosed bucket), [14] has developed an empirical model to eimate the dredging-induced sediment resuspension rates as a function of bucket size, sediment size (related to the settling velocity) and operational techniques (i.e. dredging depth and cycle time). Indeed, [48] identified bucket impact, its penetration into the bottom and withdrawal as the main contributors to sediment resuspension. Ref. [14] indicated a further resuspension source when the bucket exits from the water and swung to the point of bucket opening. Resuspended sediment concentration (Cr, in g/m3) at the dredging source are extrapolated by a linear regression analysis, obtained for measurements of SSC at various depths and distances from a number of dredging sites (i.e. St. John River, Black Rock Harbor e Calumet River):
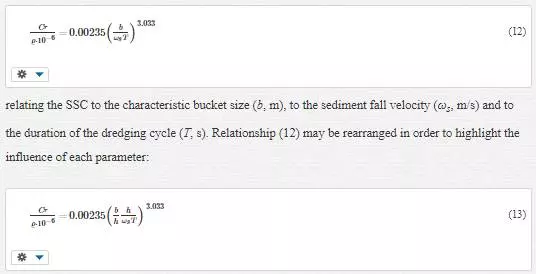
where h is the water depth. It is quite clear that the bigger the bucket size (b) compared to the water depth (h), the greater the resuspended sediment concentration. Moreover, the bigger the cycle duration (T) compared to the time spent by the sediment to settle (h /ωs), the lower the resuspended sediment concentration.
RESUSPENDED SOURCE STRENGTH
The use of mathematical modelling, either analytical or numerical, often needs the definition of the resuspension source at a point, along a line or over a surface ([14]). The strength of the resuspended sediment source, i.e. the mass (or weight) flux of sediments (e.g. [18,19]) introduced in the near field from the dredging zone, can be expressed in term of the product of SSC and velocities distributed over the source surface boundaries (e.g. [14]). Hence, the definition of sediment source strength to be used within mathematical modelling requires a description of the geometry of the boundaries source and the local velocity at those boundaries ([14]), while the concentration may be estimated by the relationships given in the previous section. In the following, the source strength models proposed by [14] are summarized. As far as cutterhead suction dredges are concerned, the resuspended sediment source volume from the bottom is assumed approximately equal to the geometry of a semi-ellipsoid with its minor axis and major axis equal to the maximum radius (Dch) and length (Lch) of the dredge-head, respectively. Nevertheless, as the cutterhead swings during the dredging activities, the actual volume over which the SSC (Cr) typically occupies is a volume larger than the defined semi-ellipsoidal source volume. Thus, the length and the vertical extent of this source volume can be estimated respectively as (1+K’ch)Lch and (1+Kch)Dch, defining the cutterhead length (K’ch) and diameter (Kch) size factors, usually lower than 1.5. If (1+Kch)Dch exceeds the water depth, the vertical extension will be limited by the water depth. Hence, cutterhead mean source strength can be expressed as:

where qch represents the sediment loss rate (g/s), i.e. the rate at which the mass of sediment is introduced into the near field with a given mean concentration (Cr, mg/l given by equation 7), Vt is the tangential velocity of the cutter blades (m/s) at the top of the cutterhead, for both overcutting (Vt=Vc+Vs) and undercutting (Vt=Vc-Vs) conditions. It has to be stressed that the velocity at the top of the cutter is a representative velocity at all points of the resuspension source. Recently, [47] proposed to use the net velocity estimated along the whole washing region. For a bucket dredge, the resuspended sediment source volume can be defined as the apparent bucket footprint multiplied by the water depth (h) at the point of the dredging location ([14]). Thus, the dredging source can be idealized as a cylindrical geometry. This geometry is only approximate because SSC can occupy a volume larger than the idealized cylindrical source volume for the turbulent mixing near the dredge-head. Hence, the source strength must be computed taking into account the increase in effective bucket size due to turbulent mixing by means a size factor (Kcb). Through this schematization of the sediment loss rate and the available field data, the function representative of the mean source strength (qdb) for typical cycle of the bucket motion is defined by:

where Cr is given by equation (12) and Kcb is a size factor (equal to 1÷2). The terms f- are the fractions of the cycle time needed to perform operations, i.e. fu is the fraction of the dredging cycle time over which the bucket is rising in the water, fd is the fraction of the cycle time over which the bucket is descending in the water, f0 is the fraction of the cycle time for which the bucket is out of the water. It could be noted that the fraction of the cycle time during which the bucket rests on or is dragged along the bottom is considered as almost negligible. The term 2h/T (i.e. the ratio of twice the water depth and cycle duration) is the estimation of the representative velocity at the source boundary.
A simplified engineering tool to estimate dredging plume transport
Simplified models may be used as economical and effective tools to provide a first order of magnitude of the far field dispersion of resuspended sediments (e.g. [4]). Typically, only steady-state simplified analytical models are available in the literature (e.g. [49–52]). Recently, [4] have proposed an analytical model aimed at describing the temporal evolution of dredging-induced resuspension in the far field forced by a continuous source term. Although simplified, such models allow carrying out a fast worst case assessment that may reveal the need of performing more complex and computational costly two- and/or three-dimensional numerical modelling. In the followings, a novel analytical model proposed by [26] is described. The model is one-dimensional, forced by whatever source term, i.e. it may vary in space and time, and the velocity field may vary in time:

where C is the concentration of resuspended sediments (i.e. depth-averaged SSC), U is the current field (constant in space), K is the diffusion coefficient, x is the spatial coordinate and t is the elapsed time. The source term (q) may vary both in time and space in order to describe the dredging resuspension source that moves in the domain and change over time as a function of operational technique and work program. Thus, plume is vertically well mixed (as assumed by [4]) and the diffusion/dispersion along the direction perpendicular to the current U is neglected. Furthermore, any sediment settling is accounted for, even if the sediment may flocculate (e.g. [50]). Hence, the model is intended to provide a worst case scenario. Moreover, the resuspension source term is constant over the entire water column, then aimed at describing mechanical dredging or shallow water hydraulic dredging (i.e. h<2.5Dch). Applying Fourier Transforms, [26] solved equation (16) for different dredging scenarios. The solution reads:

where C0 is the dredging induced SSC, H is the Heaviside step function, f is a function describing the dredging activities (hereinafter referred to as "dredging function"), N is the number of dredging cycle (N=1 for continuous hydraulic dredging, N>1 for mechanical dredging), Tdi and xi are the i-th dredging cycle duration and location, respectively. If constant velocity U0 is considered, the dredging function may be expressed as follows:
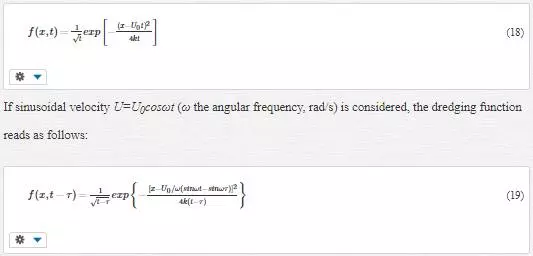
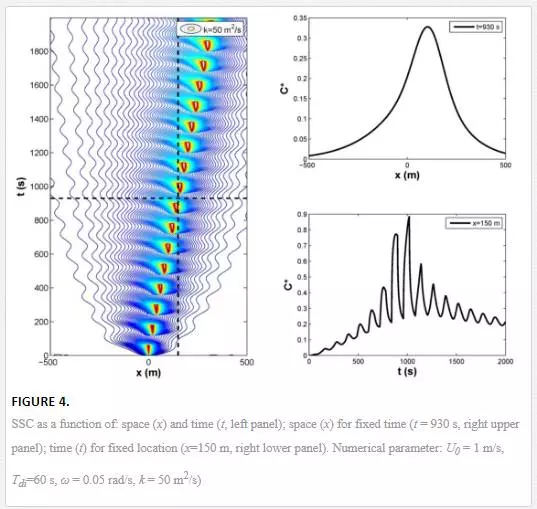
It could be noted that the dredging function expressed by equation (19) becomes equation (18) if angular frequency tends to be infinity (i.e. constant velocity). The integral solution (17) may be computed by means of standard numerical techniques. By way of example, Figure 4 shows the results obtained for mechanical dredging activities moving along the x axis. Each dredging cycle has a duration of 60 s and the angular frequency ω was kept constant to 0.05 rad/s (a quite high value of the angular frequency was used in order to highlight the model capability in catching the role of time variability of the environment current). In the figure, dimensionless concentration is shown (i.e. C*=C/C0). Example results’ inspection reveals how the model is capable to catch the main features of plume dispersion with high concentrations close to the dredging points and decreasing concentrations in the surroundings due to the oscillating current action.
Numerical modelling to estimate the SSC dredging plume
INTEGRATED APPROACH
When preliminary evaluation suggests using a more sophisticated modelling approach, integrated numerical suite may be applied in the design phase of a dredging project. In particular, a comprehensive modelling approach was proposed by [26] to support technical choices and environmental studies related to the development of dredging plume in estuarine and coastal (or semi-enclosed basin) areas.
The integrated numerical system is inspired by standard numerical suites worldwide used to oil spill modelling, with exception of oil weathering process description (e.g. [53,61]). Basically, the proposed system is made of three modules, hereinafter referred to as hydrodynamic module (HM), source module (SM) and transport module (TM): TM computes SSC distribution in the far field as a function of the resuspended sediment source (occurring during the process of removing sediment from the bottom with different mechanical and hydraulic dredges types) estimated by means of SM, and the flow field variability computed by HM. The implementation of the integrated numerical system includes the collection of input data describing the oceanographic features and environmental conditions (i.e. wind fields, tidal oscillations, etc.), resuspension dredging source and other factors affecting the plume dispersion (i.e. turbulent diffusion coefficients). Indeed, three-dimensional hydrodynamic and sediment transport models are highly recommended as the best practice to assess environmental impacts related to the SSC and pollutants (if any) dispersion due to dredging activities. These types of models provide a realistic estimation of the planar and vertical extension of the plume dynamic, both close (near field zone) and far from the resuspension sources (far field zone, e.g. [2,37,55–57]), for different environmental (i.e. environmental forcing, sediment properties, water stratification, currents) and operational (i.e. dredge types, dredging water depth, production rate, thickness of cuts, velocity of dredging cycle) conditions. Then, the implementation of three-dimensional models allows to take into account the three-dimensional features of dredging sources (i.e. of the sediment release mechanisms during the excavation of bottom sediments) that affect the SSC distribution in the water column moving out from the immediate vicinity of the dredge (dredging zone) into the far field.
The model domain should be suitable for environmental studies and thus discretized in horizontal and vertical directions with a resolution appropriate to reproduce the complexity of fluid flow and physical processes related to the dredged-induced resuspended sediment (advection, dispersion and sediment settling). Accordingly, a proper vertical discretization should be used to simulate the stratification. In detail, the simulation of dredging plume requires the definition of the dredging source, in term of its source strength and geometry, and thus of the sediment loss rate leaving the immediate vicinity of the dredge (near field area). The proper implementation of the source model (SM), based on empirical formulations (see the previous section), requires the knowledge of key components of the dredging programme (such as the dredge methodology, dredge schedule, sediment resuspension rate) in order to estimate source strength. These key components may not be well defined in the design phase of a dredging project, and this will typically be reflected in the accuracy of the predictions and in the choice of mitigation measures ([20]). Initial assumptions could require adjustments that are often unknown in the planning phases of a dredging project as they are usually based on the best available information. It could be noticed that some of the dredging parameters may be varied at the design stage to optimize the dredging activities in order to minimize the environmental impacts. The TM aims at estimating the spatial distribution and the time variation of SSC in the far field. Actually, Lagrangian and Eulerian models may be used. The Lagrangian model (i.e. random walk model, e.g. [11,25,36,58–59]) solves the trajectories equations of passive "label particles" released into the computational domain (each labelled with a representative concentration) including a diffusive term aimed at describing the turbulent fluctuations. The Eulerian approach is based on the numerical resolution of the standard advection–diffusion equation forced by the current velocities flow field and by the concentration source.
In order to identify the best timing for dredging periods, time-series from numerical results should be long enough to take into account the most representative meteomarine conditions and their seasonal variations. The use of field data and remote-sensed data (such as aerial photography) are also highly recommended to validate numerical results, in term of SSC and coastal bathymetry changes, during planning and operational phases of dredging activities [60–61].It has to be highlighted that the implementation of specific data analysis procedures to synthesize numerical results is required to compare environmental effects related to different dredging projects, and thus to support decision and risk assessment. The reader is referred to [27] that provided standard methods and statistical parameters to relate the severity of environmental effects with magnitude, duration and frequency of the exposure to high predicted SSC levels.
AUGUSTA HARBOUR CASE STUDY: HYDRODYNAMICS AND SSC DISPERSION FEATURES
The application of the proposed approach to Augusta Harbour case study (Eastern coast of Sicily Island – Italy) is briefly described in the following. The harbour was formed from the closure of most of the natural Augusta bay (early 1950s) through the construction of three breakwaters (Figure 5). The main objective of the study is to evaluate the plume dispersion resulting from hypothetical dredging activities performed within the harbour. Model results are expected to allow catching key features of dredging plumes arising from different mechanical and hydraulic dredging sources, as a function of stratified circulation patterns, as described in the following.
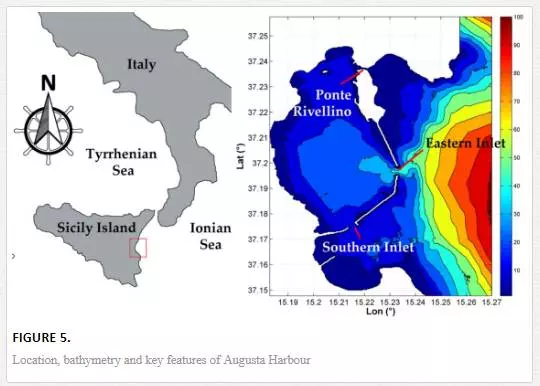
The sheltered area of this harbour, roughly equal to 24 km2, extends about 7.0 km alongshore and 3.5 km cross-shore with average water depth equal to about 15.0 m. The harbour is connected to the open sea by the eastern inlet (about 450 m wide and 40 m deep) and by the southern inlet (about 300 m wide and 20 m deep) and through the Ponte Rivellino channel (with extremely limited water depth that does not exceed 1.0 m). The small rivers flowing within the Harbour (i.e. Mulinello, Marcellino and Cantera rivers) are characterized by seasonal and discontinuous freshwater discharges. Physical characterization results showed a mainly sandy-muddy and muddy seabed. Only areas close to the western coastal zone and breakwaters are characterized by the outcropping of bedrock and coarser sediments. The harbour may be considered one of the most important Italian harbours as petrochemical pole and for bunker operations, ship repairs, ship maintenance and goods loading and unloading. Marine sediments have been highly polluted by heavy metals, especially in the southern area ([27,62,63]). Past researches payed attention to the hydrodynamic characterization of the area (e.g. [21]) in order to estimate the flushing features ([63]) related to potential environmental impacts induced by dredging activities ([27]).
It is commonly accepted in the literature that tide- and wave-driven currents play a minor role in the dispersion of the plume in the Augusta Harbour [21,26]. Indeed, due to the bathymetry (Figure 5) with high water depths, the main circulation is driven by the wind field, then it is suggested to use a three-dimensional numerical modelling, as firstly done by [26] and [21]. The three-dimensional Regional Ocean Modelling System (ROMS, e.g. [66]) has been used to estimate the circulation pattern within the harbour forced by wind fields and tidal oscillations. ROMS is a finite difference three-dimensional, free-surface, terrain-following numerical model solving the Reynolds-averaged Navier-Stokes equations, using both the hydrostatic and Boussinesq hypothesis (the reader is referred to [64] for details). The estimated current velocities and resuspension sources are then used to assess the plume dynamic. Hydrodynamic and transport models are used within the framework of decoupled approach, as hydrodynamic effect of bottom variations (due to dredging activities) upon the circulation may be neglected (e.g. [27]). The computational domain covers the whole harbour area and an offshore area needed to avoid boundaries effects on numerical results (Figure 5). A sensitivity analysis was performed to ensure an appropriate horizontal and vertical resolution, based on the bathymetry data ([60]), and on the main forces acting on the harbour. A finite difference grid with uniform spatial resolution of 40 m covering an area of 9.8 km × 12.2 km (about 75,000 computational points) was implemented. In the vertical direction, 10 layers in the sigma coordinates were used (i.e. terrain following coordinates, e.g. [66]). Numerical simulations were performed in order to analyze frequent conditions. As already anticipated, waves forcing is not considered at all since preliminary numerical simulations showed that waves-induced circulation is negligible if compared to tidal- and wind-induced ones ([21, 27, 65]). Moreover, the freshwater inputs from rivers were neglected because of their short duration and local hydrodynamic effects. Wind parameters and tidal forcing (i.e. wind speed and direction and tidal harmonic constants) are based on the analysis (e.g. [65]) of the measurements collected by the Catania Station, belonging to the Italian Mareographic Network ([62]), deployed 35 km north from Augusta Harbour.
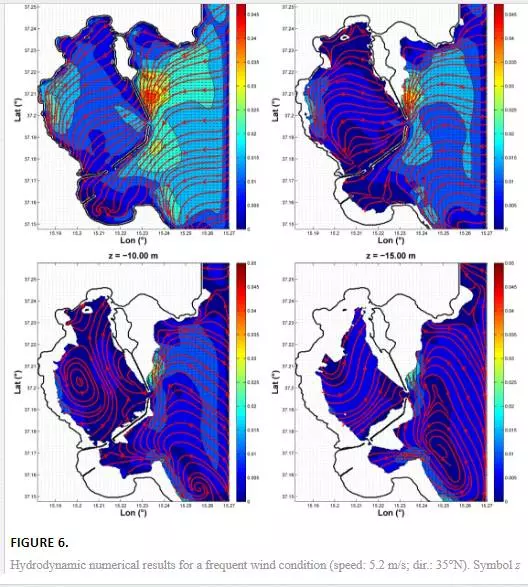
In the following, only the numerical results for wind speed equal to 5.2 m/s coming from 35°N are presented (the reader may refer to [21,26,65] to a comprehensive description of other scenarios). This scenario, characterized by small wind speed with an exceedance frequency of about 100 days per years, is selected to simulate wind-induced circulation that frequently occurs. It has to be stressed that tide-driven circulation is much less intense if compared to the wind-driven circulation. The analysis of hydrodynamic numerical results for the considered scenario (Figure 6) reveals that current intensities within the harbour reach higher values near the surface where the circulation is primarily forced by the wind action. At the bottom, higher values of current speed are generally reached close to the breakwaters and in the central part of the harbour. Moreover, the whole berthed area is interested by a significant spatial variability of the velocity field distribution. It could be observed that the current field (speed and direction) in the vertical direction varies as a function of the harbour morphology and bathymetry and of forcing conditions. At the free surface, the circulation is mainly directed as the forcing wind field. On the other hand, especially in the central part of the harbour, a strong stratification of the circulation along the water column occurs, with current direction close to the seabed opposite to wind direction. This reveals the importance of using 3D numerical model for assessing any environmental effects related to the SSC dispersion in marine and coastal water characterized by vertical flows variability, as highlighted by [21, 27].
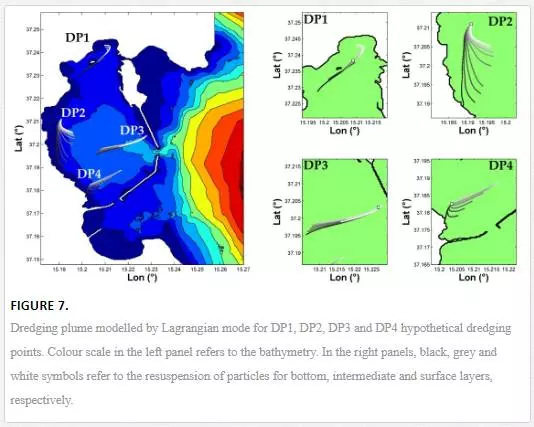
Examples of dredging plume dynamics obtained by means of Lagrangian approach are shown by Figure 7, as representative of both mechanical and hydraulic dredges performed at selected hypothetical dredging-areas (DP1, DP2, DP3 and DP4, see Figure 7). In the figure, dark symbols in the right panels indicate the fate of resuspended particles close to the bottom (i.e. by hydraulic dredges), while light symbols indicate the fate of resuspended particles close to the free surface (i.e. by mechanical dredges). It could be noted that, coherently to the current stratification produced by wind action, the dredging plume close to the bottom can escape from the enclosed basin to the open sea through a deep current characterized by a direction opposite to the surface one. Instead, at the surface layer, suspended sediments can remain confined inside the harbour depending on climatic conditions. It is worth to stress again that the simulated spatial current speed distribution and variability highlight the importance of using three-dimensional numerical modelling to ensure an effective environmental management of dredging activities. Figure 7 shows greater extensions of mechanical dredging plumes when activities are performed at DP3 and DP4 work areas if compared to DP1 and DP2 ones. In these cases, significant levels of SSC generally occur along the whole water column. While, for hydraulic dredges, characterized by a spill layer located near the bottom, greater spatial confinement as well as a higher intensity of SSC is generally observed in the immediate vicinity of the dredge. Generally, hydraulic dredges seem to generate considerable values of SSC at the surface layer only where hypothetical work areas are characterized by significant current intensities (e.g. DP2 and DP4, Figure 7).
Concluding remarks
This chapter describes the available predictive techniques to estimate different (mechanical and hydraulic) dredging resuspension sources, occurring during the process of removing sediment from the bottom, and the SSC variability related to the resulting plume dynamic. Dredging techniques most commonly used in coastal water along with potential resuspension mechanisms are reviewed. Then, predictive tools aimed at estimating the resuspension source strength and geometry based on field data are detailed. The resuspension source characterization is the first step needed to estimate the dredging plume development and related effects on water quality, aquatic ecosystem and human health. Both simplified and sophisticated tools aimed at estimating the plume dispersion are described in some detail. In particular, a novel one-dimensional analytical model is proposed to provide a fast order of magnitude of the plume dynamics when time-varying sources and time-varying currents have to be considered. The results obtained by the simplified model may be used to decide if more complex numerical modelling is needed. In such a case, an integrated and replicable numerical approach, combining a series of numerical tools, is proposed to support technical choices and environmental studies during planning and operational phases of dredging projects in estuarine and coastal (or semi-enclosed basin) areas. The application of the proposed integrated numerical approach to Augusta Harbour (Sicily Island, Italy) case study is briefly described to show typical results achievable in the design stage of the four hypothetical (mechanical and hydraulic) dredging projects.