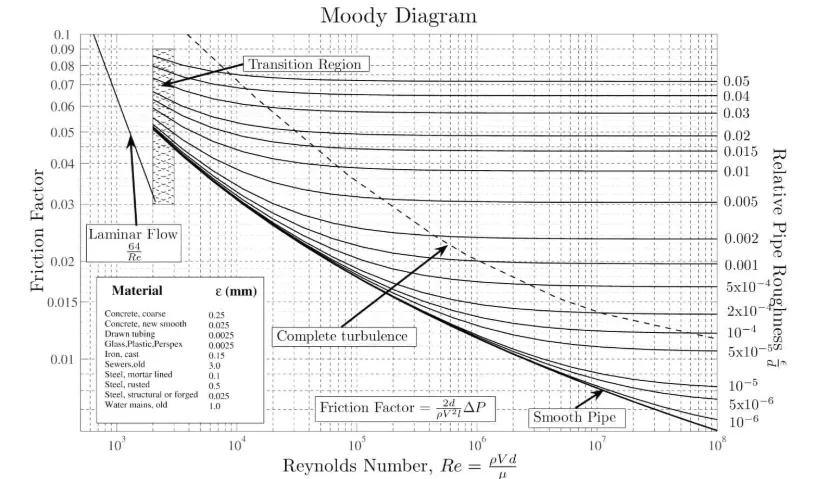
Moody Diagram
The Moody diagram (also known as the Moody chart) is a graph in non-dimensional form that relates the Darcy friction factor, Reynolds number, and the relative roughness for fully developed flow in a circular pipe.
Determine the friction factor (fD) for fluid flow in a pipe of 700mm in diameter that has the Reynolds number of 50 000 000 and an absolute roughness of 0.035 mm.
Solution:
The relative roughness is equal to ε = 0.035 / 700 = 5 x 10⁻⁵. Using the Moody Chart, a Reynolds number of 50 000 000 intersects the curve corresponding to a relative roughness of 5 x 10⁻⁵ at a friction factor of 0.011.
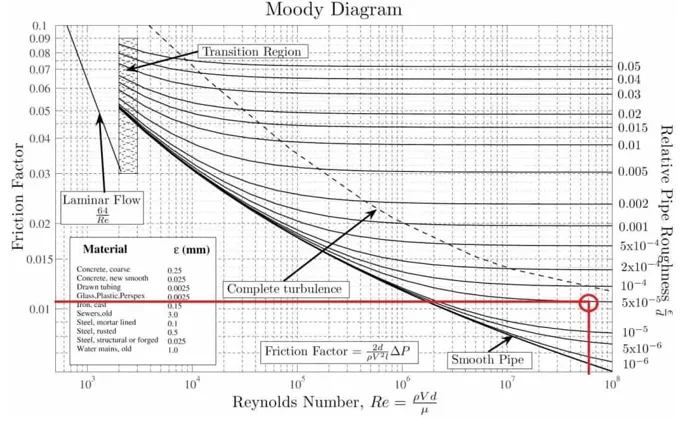
Example: Moody chart.
Darcy Friction Factor for various flow regime
The most common classification of flow regimes is according to the Reynolds number. The Reynolds number is a dimensionless number comprised of the physical characteristics of the flow and it determines whether the flow is laminar or turbulent. An increasing Reynolds number indicates an increasing turbulence of flow. As can be seen from the Moody chart, also Darcy friction factor is highly dependent on the flow regime (i.e. on the Reynolds number).