Eutectic phase diagrams
Materials showing a eutectic phase diagram often are technically highly relevant.
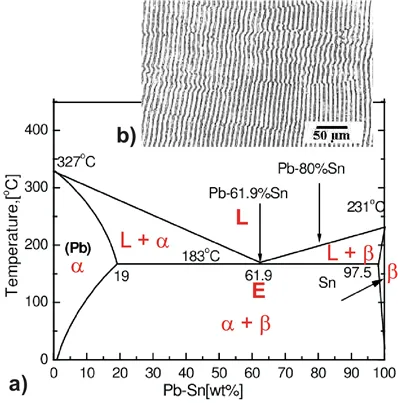
Figure 2.12: a) Eutectic phase diagram of PbSn. b) lamellar structure of solidified Pb Sn with eutectic composition.
Eutectic is Greek and means low/well melting. One of the most important eutectic’s is tin-lead (Sn-Pb) used for soldering. Another interesting example is indium-gallium (InGa) which is liquid just above room temperature and allows for easy ohmic contacts on semiconductors like Si. The tin lead phase diagram is shown in Fig. 2.12 a). The eutectic point (marked by E) has a temperature below 200oC and a Sn concentration somewhat above 70%. The eutectic composition is melting completely at the lowest temperature. The melt will solidify directly without splitting up into two phases. As a consequence the eutectic composition does not have to be cooled down extremely slowly in order to get a reasonably homogeneous solid. We will find nicely ordered lamellas of Pb and Sn as shown in Fig. 2.12 b).
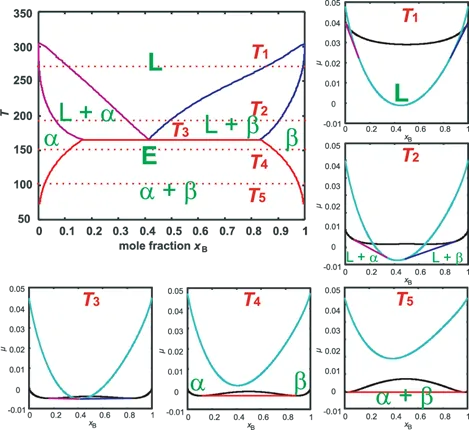
In order to understand a eutectic phase diagram we have to combine the g-plots of mixtures with a miscibility gap as shown in Fig. 2.1 b) and the g-plots of mixtures defining the liquidus and solidus lines as shown in Fig. 2.11.
As discussed in section 2.1 a miscibility gap occurs for a dominant repulsive interaction between the two components of a mixture. With increasing temperature the entropy gets more dominant, reducing the regime of phase separation until at a certain high temperature (Ω∕RT=β=2) phase separation vanishes and complete miscibility exists. A eutectic phase diagram is found if the Gibbs potential of the solid phase with a miscibility gap becomes larger than the Gibbs potential of the liquid phase. The relation between the eutectic phase diagram and the g-plots for several temperatures is shown in Fig. 2.13.
First we will repeat some basics about labeling phases. As usual homogeneous phases are labeled by Greek characters. Here α is a Pb rich phase with a small amount of solved Sn. Correspondingly β is a Sn rich phase with a small fraction of solved Pb. In between we have a phase separation of both phases α+β with a composition following the lever rule. The phase boundaries here therefore mark the limits of solubility in solid solution. At eutectic temperature the Gibbs potential of the liquid phase L tangents the Maxwell line of phase separation α+β implying the beginning of a phase separation between L +α and L +β. At the eutectic point we have on common tangent (representing one chemical potential) between three points with fixed compositions at a fixed temperature Teut. Therefore the horizontal straight line connection the three phases in the phase diagram has F=0, i.e. no degrees of freedom.
Above the eutectic temperature two regimes with phase separation exist representing the two common tangents in the g-plots for T1 and T2indicating mixtures of liquid and solid phases α resp. β. For different temperatures the thermodynamically stable composition of the phases α resp. β change. To reach always this stable composition takes long times within a solid. This is the reason why cooling down at a non eutectic composition results in a solid with a very inhomogeneous concentration distribution of Pb and Sn (if not cooled down infinitely slowly). In strong contrast cooling down at eutectic composition leads to a solidification at lowest possible temperature with a constant eutectic composition of the solid and a micro structure as illustrated in Fig. 2.12 b). Here the lamellar structure basically reflects just the repulsive interaction between Pb and Sn.
So it is the eutectic reaction
(2.66) |
which allows for an efficient stable soldering process.
Figure 2.13: Schematic eutectic phase diagram. For the 5 temperatures the corresponding Gibbs potentials and Maxwell constructions for phase separation are shown.