Binary diagrams:
These diagrams constitutes two components, e.g.: two metals (Cu and Ni), or a metal and a compound (Fe and Fe3C), or two compounds (Al2O3 and Si2O3), etc. In most engineering applications, as mentioned before, condensed phase rule is applicable. It is assumed that the same is applicable for all binary diagrams, thus the presentation of binary diagrams becomes less complicated. Thus binary diagrams are usually drawn showing variations in temperature and composition only. It is also to be noted that all binary systems consist only one liquid phase i.e. a component is completely soluble in the other component when both are in liquid state.
Hence, binary systems are classified according to their solid solubility. If both the components are completely soluble in each other, the system is called isomorphous system. E.g.: Cu-Ni, Ag-Au, Ge-Si, Al2O3-Cr2O3. Extent solid solubility for a system of two metallic components can be predicted based on Hume-Ruthery conditions, summarized in the following:
· Crystal structure of each element of solid solution must be the same.
· Size of atoms of each two elements must not differ by more than 15%.
· Elements should not form compounds with each other i.e. there should be no appreciable difference in the electro-negativities of the two elements.
· Elements should have the same valence.
All the Hume-Rothery rules are not always applicable for all pairs of elements which show complete solid solubility.
In systems other than isomorphous systems i.e. in case of limited solid solubility, there exist solid state miscibility gaps; number of invariant reactions can take place; intermediate phases may exist over a range of composition (intermediate solid solutions) or only at relatively fixed composition (compound). These intermediate phases may undergo polymorphic transformations, and some may melt at a fixed temperature (congruent transformations, in which one phase changes to another of the same composition at definite temperature). A solid solution based on a pure component and extending to certain finite compositions into a binary phase diagram is called a terminal solid solution, and the line representing the solubility limit of a terminal solid solution w.r.t a two-phase solid region is called a solvus line (figure-4).
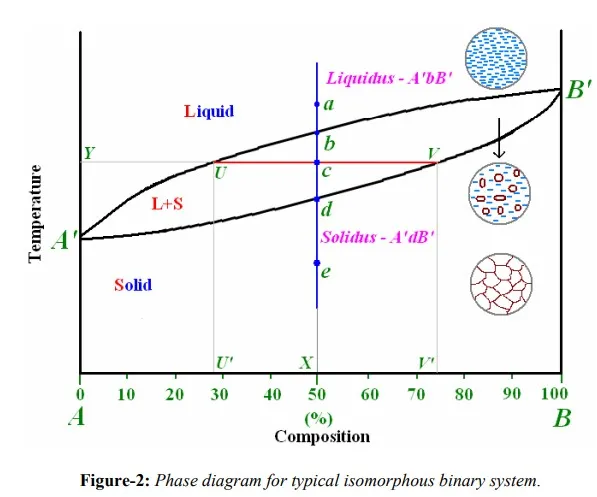
Isomorphous system: Figure-2 depicts a typical phase diagram for an isomorphous system made of two metallic elements A and B. As cited earlier, any phase diagram can be considered as a map. A set of coordinates – a temperature and a composition – is associated with each point in the diagram. If the alloy composition and temperature specified, then the phase diagram allows determination of the phase or phases that will present under equilibrium conditions. There are only two phases in the phase diagram, the liquid and the solid phases. These single-phases regions are separated by a two-phase region where both liquid and solid co-exist. The area in the figure-2 above the line marked liquidus (A’bB’) corresponds to the region of stability of the liquid phase, and the area below the solidus line (A’dB’) represents the stable region for the solid phase.
For the interpretation of the phase diagram, let’s consider the vertical line ae drawn corresponding to composition of 50%A +50%B and assume that the system is undergoing equilibrium cooling. The point a on the line ae signifies that for that particular temperature and composition, only liquid phase is stable. This is true up to the point b which lies on the liquidus line, representing the starting of solidification. Completion of solidification of the alloy is represented by the point, d. Point e corresponds to singlephase solid region up to the room temperature. Point c lies in the two-phase region made of both liquid and solid phases. Corresponding micro-structural changes are also shown in figure-2. As shown in figure-2, above liquidus only a liquid phase exists, and below the solidus single solid phase exists as completely solidified grains. Between these two lines, system consist both solid crystals spread in liquid phase. It is customary to use L to represent liquid phase(s) and Greek alphabets (α, β, γ) for representing solid phases.
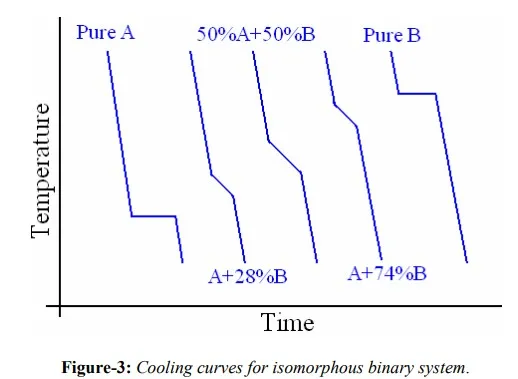
Between two extremes of the horizontal axis of the diagram, cooling curves for different alloys are shown in figure-3 as a function of time and temperature. Cooling curves shown in figure-3 represent A, U’, X, V’ and B correspondingly in figure-2. Change in slope of the cooling curve is caused by heat of fusion. In fact these changes in slope are nothing but points on either solidus or liquidus of a phase diagram. An experimental procedure where repeated cooling/heating of an alloy at different compositions, and corresponding changes in slope of cooling curves will be used to construct the phase diagram.
Another important aspect of interpreting phase diagrams along with phases present is finding the relative amount of phases present and their individual composition.
Procedure to find equilibrium concentrations of phases:
Ø A tie-line or isotherm (UV) is drawn across two-phase region to intersect the boundaries of the region.
Ø Perpendiculars are dropped from these intersections to the composition axis, represented by U’ and V’ in figure-2, from which each of each phase is read. U’ represents composition of liquid phase and V’ represents composition of solid phase as intersection U meets liquidus line and V meets solidus line.
Procedure to find equilibrium relative amounts of phases (lever rule):
ü A tie-line is constructed across the two phase region at the temperature of the alloy to intersect the region boundaries.
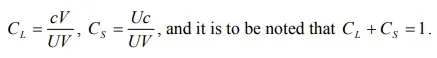
ü The relative amount of a phase is computed by taking the length of tie line from overall composition to the phase boundary for the other phase, and dividing by the total tie-line length. From figure-2, relative amounts of liquid and solid phases is given respectively by