Equilibrium Phase Diagrams
A diagram that depicts existence of different phases of a system under equilibrium is termed as phase diagram. It is also known as equilibrium or constitutional diagram. Equilibrium phase diagrams represent the relationships between temperature and the compositions and the quantities of phases at equilibrium. In general practice it is sufficient to consider only solid and liquid phases, thus pressure is assumed to be constant (1 atm.) in most applications. These diagrams do not indicate the dynamics when one phase transforms into another. However, it depicts information related to microstructure and phase structure of a particular system in a convenient and concise manner. Important information, useful for the scientists and engineers who are involved with materials development, selection, and application in product design, obtainable from a phase diagram can be summarized as follows:
-To show phases are present at different compositions and temperatures under slow cooling (equilibrium) conditions.
- To indicate equilibrium solid solubility of one element/compound in another.
- To indicate temperature at which an alloy starts to solidify and the range of solidification.
- To indicate the temperature at which different phases start to melt.
- Amount of each phase in a two-phase mixture can be obtained.
A phase diagram is actually a collection of solubility limit curves. The phase fields in equilibrium diagrams depend on the particular systems being depicted. Set of solubility curves that represents locus of temperatures above which all compositions are liquid are called liquidus, while solidus represents set of solubility curves that denotes the locus of temperatures below which all compositions are solid. Every phase diagram for two or more components must show a liquidus and a solidus, and an intervening freezing range, except for pure system, as melting of a phase occurs over a range of temperature. Whether the components are metals or non-metals, there are certain locations on the phase diagram where the liquidus and solidus meet. For a pure component, a contact point lies at the edge of the diagram. The liquidus and solidus also meet at the other invariant positions on the diagram. Each invariant point represents an invariant reaction that can occur only under a particular set of conditions between particular phases, so is the name for it!
Phase diagrams are classified based on the number of components in the system. Single component systems have unary diagrams, two-component systems have binary diagrams, three-component systems are represented by ternary diagrams, and so on. When more than two components are present, phase diagrams become extremely complicated and difficult to represent. This chapter deals mostly with binary phase diagrams.
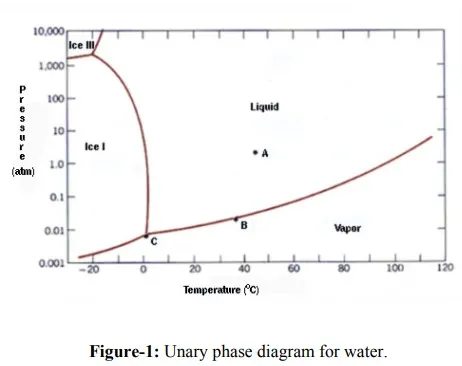
Unary diagrams: In these systems there is no composition change (C=1), thus only variables are temperature and pressure. Thus in region of single phase two variables (temperature and pressure) can be varied independently. If two phases coexist then, according to Phase rule, either temperature or pressure can be varied independently, but not both. At triple points, three phases can coexist at a particular set of temperature and pressure. At these points, neither temperature nor the pressure can be changed without disrupting the equilibrium i.e. one of the phases may disappear. Figure-1 depicts phase diagram for water.