Frequency Response
Frequency Response of an amplifier or filter shows how the gain of the output responds to input signals at different frequencies
Amplifiers and filters are widely used electronic circuits that have the properties of amplification and filtration, hence their names. Amplifiers produce gain while filters alter the amplitude and/or phase characteristics of an electrical signal with respect to its frequency. As these amplifiers and filters use resistors, inductors, or capacitor networks (RLC) within their design, there is an important relationship between the use of these reactive components and the circuits frequency response characteristics. When dealing with AC circuits it is assumed that they operate at a fixed frequency, for example either 50 Hz or 60 Hz. But the response of a linear AC circuit can also be examined with an AC or sinusoidal input signal of a constant magnitude but with a varying frequency such as those found in amplifier and filter circuits. This then allows such circuits to be studied using frequency response analysis.
Frequency Response of an electric or electronics circuit allows us to see exactly how the output gain (known as the magnitude response) and the phase (known as the phase response) changes at a particular single frequency, or over a whole range of different frequencies from 0Hz, (d.c.) to many thousands of mega-hertz, (MHz) depending upon the design characteristics of the circuit. Generally, the frequency response analysis of a circuit or system is shown by plotting its gain, that is the size of its output signal to its input signal, Output/Input against a frequency scale over which the circuit or system is expected to operate. Then by knowing the circuits gain, (or loss) at each frequency point helps us to understand how well (or badly) the circuit can distinguish between signals of different frequencies. The frequency response of a given frequency dependent circuit can be displayed as a graphical sketch of magnitude (gain) against frequency (ƒ). The horizontal frequency axis is usually plotted on a logarithmic scale while the vertical axis representing the voltage output or gain, is usually drawn as a linear scale in decimal divisions. Since a systems gain can be both positive or negative, the y-axis can therefore have both positive and negative values.
In Electronics, the Logarithm, or “log” for short is defined as the power to which the base number must be raised to get that number. Then on a Bode plot, the logarithmic x-axis scale is graduated in log10 divisions, so every decade of frequency (e.g, 0.01, 0.1, 1, 10, 100, 1000, etc.) is equally spaced onto the x-axis. The opposite of the logarithm is the antilogarithm or “antilog”.
Graphical representations of frequency response curves are called Bode Plots and as such Bode plots are generally said to be a semi-logarithmic graphs because one scale (x-axis) is logarithmic and the other (y-axis) is linear (log-lin plot) as shown.
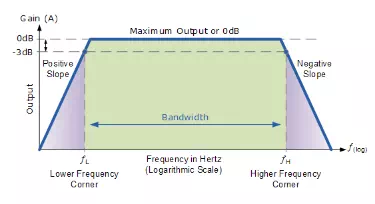
Frequency Response Curve

Then we can see that the frequency response of any given circuit is the variation in its behaviour with changes in the input signal frequency as it shows the band of frequencies over which the output (and the gain) remains fairly constant. The range of frequencies either big or small between ƒL and ƒH is called the circuits bandwidth. So from this we are able to determine at a glance the voltage gain (in dB) for any sinusoidal input within a given frequency range. As mentioned above, the Bode diagram is a logarithmic presentation of the frequency response. Most modern audio amplifiers have a flat frequency response as shown above over the whole audio range of frequencies from 20 Hz to 20 kHz. This range of frequencies, for an audio amplifier is called its Bandwidth, (BW) and is primarily determined by the frequency response of the circuit.
Frequency points ƒL and ƒH relate to the lower corner or cut-off frequency and the upper corner or cut-off frequency points respectively were the circuits gain falls off at high and low frequencies. These points on a frequency response curve are known commonly as the -3dB (decibel) points. So the bandwidth is simply given as:
![]()
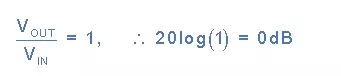
The decibel, (dB) which is 1/10th of a bel (B), is a common non-linear unit for measuring gain and is defined as 20log10(A) where A is the decimal gain, being plotted on the y-axis. Zero decibels, (0dB) corresponds to a magnitude function of unity giving the maximum output. In other words, 0dB occurs when Vout = Vin as there is no attenuation at this frequency level and is given as:
We see from the Bode plot above that at the two corner or cut-off frequency points, the output drops from 0dB to -3dB and continues to fall at a fixed rate. This fall or reduction in gain is known commonly as the roll-off region of the frequency response curve. In all basic single order amplifier and filter circuits this roll-off rate is defined as 20dB/decade, which is an equivalent to a rate of 6dB/octave. These values are multiplied by the order of the circuit. These -3dB corner frequency points define the frequency at which the output gain is reduced to 70.71% of its maximum value. Then we can correctly say that the -3dB point is also the frequency at which the systems gain has reduced to 0.707 of its maximum value.