Motion
of a Mass on a Spring
In a previous part of this lesson, the motion of a
mass attached to a spring was described as an example of a vibrating system.
The mass on a spring motion was discussed in more detail as we sought to
understand the mathematical properties of objects that are in periodic motion. Now we will investigate the motion of a mass on a spring in even
greater detail as we focus on how a variety of quantities change over the
course of time. Such quantities will include forces, position, velocity and
energy - both kinetic and potential energy.
 Hooke's Law
We will begin our discussion with an investigation of the
forces exerted by a spring on a hanging mass. Consider the system shown at the
right with a spring attached to a support. The spring hangs in a relaxed, unstretched position. If you were to hold the bottom
of the spring and pull downward, the spring would stretch. If you were to pull
with just a little force, the spring would stretch just a little bit. And if
you were to pull with a much greater force, the spring would stretch a much
greater extent. Exactly what is the quantitative relationship between the
amount of pulling force and the amount of stretch?
To determine this quantitative relationship between the
amount of force and the amount of stretch, objects of known mass could be
attached to the spring. For each object which is added, the amount of stretch
could be measured. The force which is applied in each instance would be the
weight of the object. A regression analysis of the force-stretch data could be
performed in order to determine the quantitative relationship between the force
and the amount of stretch. The data table below shows some representative data
for such an experiment.
|
Mass
(kg) |
Force
on Spring (N) |
Amount
of Stretch (m) |
|
0.000 |
0.000 |
0.0000 |
|
0.050 |
0.490 |
0.0021 |
|
0.100 |
0.980 |
0.0040 |
|
0.150 |
1.470 |
0.0063 |
|
0.200 |
1.960 |
0.0081 |
|
0.250 |
2.450 |
0.0099 |
|
0.300 |
2.940 |
0.0123 |
|
0.400 |
3.920 |
0.0160 |
|
0.500 |
4.900 |
0.0199 |
By plotting the force-stretch data and performing a linear
regression analysis, the quantitative relationship or equation can be
determined. The plot is shown below.

A linear regression analysis yields the following statistics:
slope = 0.00406 m/N
y-intercept = 3.43 x10⁻⁵ (pert near close to 0.000)
regression constant = 0.999
The equation for this line is
Stretch = 0.00406Force + 3.43x10⁻⁵
 The fact that the regression constant is very close to 1.000 indicates
that there is a strong fit between the equation and the data
points. This strong fit lends credibility to the results of
the experiment.
This relationship between the force applied to a spring and
the amount of stretch was first discovered in 1678 by English scientist Robert
Hooke. As Hooke put it: Ut tensio, sic vis.
Translated from Latin, this means "As the extension, so the force."
In other words, the amount that the spring extends is proportional to the
amount of force with which it pulls. If we had completed this study about 350
years ago (and if we knew some Latin), we would be famous! Today this
quantitative relationship between force and stretch is referred to as Hooke's
law and is often reported in textbooks as
Fspring = -kx
where Fspring is the force exerted upon the spring, x is the amount that the spring
stretches relative to its relaxed position, and k is the proportionality
constant, often referred to as the spring constant. The spring constant is a
positive constant whose value is dependent upon the spring which is being
studied. A stiff spring would have a high spring constant. This is to say that
it would take a relatively large amount of force to cause a little
displacement. The units on the spring constant are Newton/meter (N/m). The
negative sign in the above equation is an indication that the direction that
the spring stretches is opposite the direction of the force which the spring
exerts. For instance, when the spring was stretched below its relaxed position,
x is downward. The spring
responds to this stretching by exerting an upward force. The x and the F are in opposite
directions. A final comment regarding this equation is that it works for a
spring which is stretched vertically and for a spring is stretched horizontally
(such as the one to be discussed below).
Force
Analysis of a Mass on a Spring
Earlier in this lesson we learned that an
object that is vibrating is acted upon by a restoring force. The restoring
force causes the vibrating object to slow down as it moves away from the
equilibrium position and to speed up as it approaches the equilibrium position.
It is this restoring force which is responsible for the vibration. So what is
the restoring force for a mass on a spring?
We will begin our discussion of this question by considering
the system in the diagram below.

The diagram shows an air track and a glider. The glider is
attached by a spring to a vertical support. There is a negligible amount of
friction between the glider and the air track. As such, there are three
dominant forces acting upon the glider. These three forces are shown in the
free-body diagram at the right. The force of gravity (Fgrav)
is a rather predictable force - both in terms of its magnitude and its
direction. The force of gravity  always acts downward; its magnitude can be found as the product of mass
and the acceleration of gravity (m9.8 N/kg).
The support force (Fsupport) balances the
force of gravity. It is supplied by the air from the air track, causing the
glider to levitate about the track's surface. The final
force is the spring force (Fspring). As
discussed above, the spring force varies in magnitude and in direction. Its
magnitude can be found using Hooke's law. Its direction is always opposite the
direction of stretch and towards the equilibrium position. As the air track
glider does the back and forth,
the spring force (Fspring) acts as the
restoring force. It acts leftward on the glider when it is positioned to the
right of the equilibrium position; and it acts rightward on the glider when it
is positioned to the left of the equilibrium position.
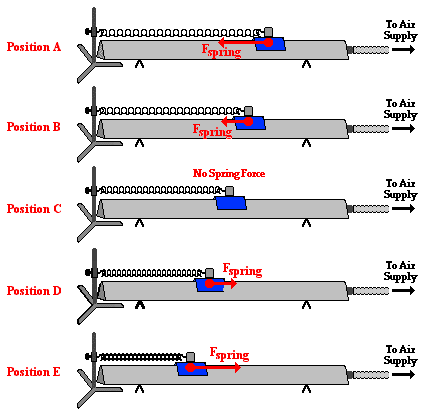
Let's suppose that the glider is pulled to the right of the
equilibrium position and released from rest. The diagram below shows the
direction of the spring force at five different positions over the course of
the glider's path. As the glider moves from position A (the release point) to
position B and then to position C, the spring force acts leftward upon the
leftward moving glider. As the glider approaches position C, the amount of
stretch of the spring decreases and the spring force decreases, consistent with
Hooke's Law. Despite this decrease in the spring force, there is still an
acceleration caused by the restoring force for the entire span from position A
to position C. At position C, the glider has reached its maximum speed. Once
the glider passes to the left of position C, the spring force acts rightward.
During this phase of the glider's cycle, the spring is being compressed. The
further past position C that the glider moves, the greater the amount of
compression and the greater the spring force. This spring force acts as a
restoring force, slowing the glider down as it moves from position C to
position D to position E. By the time the glider has reached position E, it has
slowed down to a momentary rest position before changing its direction and
heading back towards the equilibrium position. During the glider's motion from
position E to position C, the amount that the spring is compressed decreases
and the spring force decreases. There is still an acceleration for the entire
distance from position E to position C. At position C, the glider has reached
its maximum speed. Now the glider begins to move to the right of point C. As it
does, the spring force acts leftward upon the rightward moving glider. This
restoring force causes the glider to slow down during the entire path from
position C to position D to position E.
Sinusoidal Nature of the Motion of a Mass on
a Spring
Previously in this lesson, the variations in
the position of a mass on a spring with respect to time were discussed. At that
time, it was shown that the position of a mass on a spring varies with the sine
of the time. The discussion pertained to a mass that was vibrating up and down
while suspended from the spring. The discussion would be just as applicable to
our glider moving along the air track. If a motion detector were placed at the
right end of the air track to collect data for a position vs. time plot, the
plot would look like the plot below. Position A is the right-most position on
the air track when the glider is closest to the detector.

The labeled positions in
the diagram above are the same positions used in the discussion of restoring
force above. You might recall from that discussion that positions A and E were
positions at which the mass had a zero velocity. Position C was the equilibrium
position and was the position of maximum speed. If the same motion detector
that collected position-time data were used to collect velocity-time data, then
the plotted data would look like the graph below.
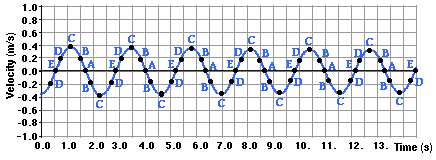
Observe that the velocity-time plot for the mass on a spring
is also a sinusoidal shaped plot. The only difference between the position-time
and the velocity-time plots is that one is shifted one-fourth of a vibrational cycle
away from the other. Also observe in the plots that the absolute value of the
velocity is greatest at position C (corresponding to the equilibrium position).
The velocity of any moving object, whether vibrating or not, is the speed with a
direction. The magnitude of the velocity is the speed. The direction is often
expressed as a positive or a negative sign. In some instances, the velocity has
a negative direction (the glider is moving leftward) and its velocity is
plotted below the time axis. In other cases, the velocity has a positive
direction (the glider is moving rightward) and its velocity is plotted above
the time axis. You will also notice that the velocity is zero whenever the
position is at an extreme. This occurs at positions A and E when the glider is
beginning to change direction. So just as in the case of pendulum motion, the speed is
greatest when the displacement of the mass relative to its equilibrium position
is the least. And the speed is least when the displacement of the mass relative
to its equilibrium position is the greatest.
Energy
Analysis of a Mass on a Spring
On the previous page, an energy analysis for the vibration of a
pendulum was discussed. Here we will conduct a similar analysis for the motion
of a mass on a spring. In our discussion, we will refer to the motion of the
frictionless glider on the air track that was introduced above. The glider will
be pulled to the right of its equilibrium position and be released from rest
(position A). As mentioned, the glider then accelerates towards position C (the
equilibrium position). Once the glider passes the equilibrium position, it
begins to slow down as the spring force pulls it backwards against its motion.
By the time it has reached position E, the glider has slowed down to a momentary
pause before changing directions and accelerating back towards position C. Once
again, after the glider passes position C, it begins to slow down as it
approaches position A. Once at position A, the cycle begins all over again ...
and again ... and again.
The kinetic energy possessed by an object is the energy it possesses
due to its motion. It is a quantity that depends upon both mass and speed. The
equation that relates kinetic energy (KE) to
mass (m) and speed (v)
is
KE = ½mv2
The faster an object moves, the more kinetic energy that it
will possess. We can combine this concept with the discussion above about how
speed changes during the course of motion. This blending of the concepts would
lead us to conclude that the kinetic energy of the mass on the spring increases
as it approaches the equilibrium position; and it decreases as it moves away
from the equilibrium position.
This information is summarized in the table below:
|
Stage of Cycle |
Change in Speed |
Change in Kinetic Energy |
|
A to B to C |
Increasing |
Increasing |
|
C to D to E |
Decreasing |
Decreasing |
|
E to D to C |
Increasing |
Increasing |
|
C to B to A |
Decreasing |
Decreasing |
Kinetic energy is only one form of mechanical energy. The
other form is potential energy. Potential energy is the stored energy of
position possessed by an object. The potential energy could be gravitational
potential energy, in which case the position refers to the height above the
ground. Or the potential energy could be elastic potential energy, in which case the
position refers to the position of the mass on the spring relative to the
equilibrium position. For our vibrating air track glider, there is no change in
height. So the gravitational potential energy does not change. This form of
potential energy is not of much interest in our analysis of the energy changes.
There is however a change in the position of the mass relative to its
equilibrium position. Every time the spring is compressed or stretched relative
to its relaxed position, there is an increase in the elastic potential energy.
The amount of elastic potential energy depends on the amount of stretch or
compression of the spring. The equation that relates the amount of elastic
potential energy (PEspring) to the amount of
compression or stretch (x) is
PEspring = ½ kx2
where k is the spring constant (in N/m) and x is the distance that the spring is
stretched or compressed relative to the relaxed, unstretched position.
When the air track glider is at its equilibrium position
(position C), it is moving it's fastest (as
discussed above). At this position, the value of x is 0 meter. So the amount of
elastic potential energy (PEspring) is 0
Joules. This is the position where the potential energy is the least. When the
glider is at position A, the spring is stretched the greatest distance and the
elastic potential energy is a maximum. A similar statement can be made for
position E. At position E, the spring is compressed the most and the elastic
potential energy at this location is also a maximum. Since the spring stretches
as much as compresses, the elastic potential energy at position A (the stretched position) is the same as at position E
(the compressedposition).
At these two positions - A and E - the velocity is 0 m/s and the kinetic energy
is 0 J. So just like the case of a vibrating pendulum, a vibrating mass
on a spring has the greatest potential energy when it has the smallest kinetic
energy. And it also has the smallest potential energy (position C) when it has
the greatest kinetic energy. These principles are shown in the animation below.

When conducting an energy analysis, a common
representation is an energy bar chart. An energy bar chart uses a bar graph to
represent the relative amount and form of energy possessed by an object as it
is moving. It is a useful conceptual tool for showing what form of energy is
present and how it changes over the course of time. The diagram below is an
energy bar chart for the air track glider and spring system.
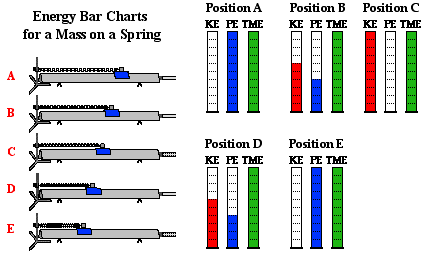
The bar chart reveals that as the mass on the spring moves
from A to B to C, the kinetic energy increases and the elastic potential energy
decreases. Yet the total amount of these two forms of mechanical energy remains
constant. Mechanical energy is being transformed from potential form to kinetic
form; yet the total amount is being conserved.
A similar conservation of energy phenomenon occurs as the mass moves from C to
D to E. As the spring becomes compressed and the mass slows down, its kinetic
energy is transformed into elastic potential energy. As this transformation
occurs, the total amount of mechanical energy is conserved. This very principle
of energy conservation was explained in a previous chapter - the Energy chapter - of The Physics
Classroom Tutorial.
Period
of a Mass on a Spring
As is likely obvious, not all springs are created equal. And
not all spring-mass systems are created equal. One measurable quantity that can
be used to distinguish one spring-mass system from another is the period. As
discussed earlier in this lesson, the period is the time for a vibrating object
to make one complete cycle of vibration. The variables that effect the period
of a spring-mass system are the mass and the spring constant. The equation that
relates these variables resembles the equation for the period of a
pendulum. The equation is
T = 2Π(m/k).5
where T is the period, m is
the mass of the object attached to the spring, and k is the spring constant of the spring.
The equation can be interpreted to mean that more massive objects will vibrate
with a longer period. Their greater inertia means that it takes more time to complete a cycle. And springs with a
greater spring constant (stiffer springs) have a smaller period; masses
attached to these springs take less time to complete a cycle. Their greater
spring constant means they exert stronger restoring forces upon the attached
mass. This greater force reduces the length of time to complete one cycle of
vibration.
Looking
Forward to Lesson 2
As we have seen in this lesson, vibrating objects are wiggling in place. They
oscillate back and forth about a fixed position. A simple pendulum and a mass
on a spring are classic examples of such vibrating motion. Though not evident
by simple observation, the use of motion detectors reveals that the vibrations
of these objects have a sinusoidal nature. There is a subtle wave-like behavior associated with the manner in which the
position and the velocity vary with respect to time. In the next lesson, we
will investigate waves. As we will soon find out, if a mass on a spring is a wiggle in time, then a wave is
a collection of wigglers
spread through space. As we begin our study of waves in Lesson 2, concepts
of frequency, wavelength and amplitude will remain important.
Check Your Understanding
1. A force of 16 N is required to stretch a spring a distance
of 40 cm from its rest position. What force (in Newtons)
is required to stretch the same spring
a.
twice the distance?
b.
three times the distance?
c.
one-half the distance?

Answer:
Ut tensio,
sic vis. As the extension, so the force. Force and
stretch are proportional to one another such that if you double the force, the
amount of stretch will double. If you triple the force, the amount of stretch
will triple. If you half the force, the amount of stretch will halve. So the
answers here are:
a. 32 N (twice
the stretch requires twice the force)
b. 48 N (three times the stretch requires three times the
force)
c. 8 N (one-half the stretch requires one-half the force)
2. Perpetually disturbed by the habit of the backyard
squirrels to raid his bird feeders, Mr. H decides to use a little physics for
better living. His current plot involves equipping his bird feeder with a
spring system that stretches and oscillates when the mass of a squirrel lands
on the feeder. He wishes to have the highest amplitude of vibration that is
possible. Should he use a spring with a large spring constant or a small spring
constant?

Answer:
Mr.
H should use a
spring with a low spring constant (k). The spring constant (k in the
Hooke's law equation) is the ratio of the F/x. If this ratio is low, then there
will be a relatively large displacement for any given F value. Being displaced
furthest from the equilibrium position will set the spring into a relatively
high amplitude vibrational motion.
3. Referring to the previous question. If Mr. H wishes to
have his bird feeder (and attached squirrel) vibrate with the highest possible
frequency, should he use a spring with a large spring constant or a small
spring constant?

Answer:
Mr. H should use a spring with a large spring constant (k).
Using a large spring constant (k) will cause the period to be small. A small
period corresponds to a high frequency. Get them squirrels, Mr. H!
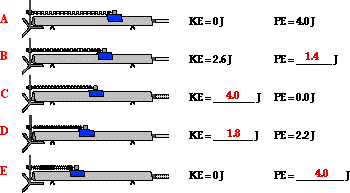
4. Use energy conservation to fill in the blanks in the
following diagram.
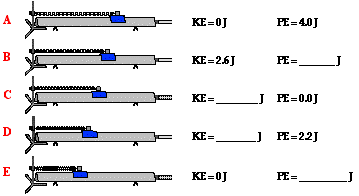

Answer: Energy is conserved. So the total amount of KE + PE must
be the same for each location.
5. Which of the following mass-spring systems will have the
highest frequency of vibration?
Case A: A spring with a k=300 N/m and a mass of 200 g
suspended from it.
Case B: A spring with a k=400 N/m and a mass of 200 g suspended from it.

Answer: Case B has the highest frequency.
Frequency and
period are inversely related. The highest frequency will have the shortest
(smallest) period. Both springs have the same mass; only the spring constant
(k) is different. A spring with a higher spring constant will have a shorter
period. This is consistent with the equation for period.
6. Which of the following mass-spring systems will have the
highest frequency of vibration?
Case A: A spring with a k=300 N/m and a mass of 200 g
suspended from it.
Case B: A spring with a k=300 N/m and a mass of 100 g suspended from it.

Answer: Case B has the highest frequency.
Frequency and
period are inversely related. The highest frequency will have the shortest
(smallest) period. Both springs have the same spring constant; only the
suspended mass (m) is different. A spring with a smaller suspended mass will
have a shorter period. This is consistent with the equation for period.