Relating the Shape to the Motion
·
As discussed in a previous part of Lesson
4, the shape of a velocity vs. time graph reveals pertinent information about
an object's acceleration. For example, if the acceleration is zero, then the
velocity-time graph is a horizontal line - having a slope of zero. If the
acceleration is positive, then the line is an upward sloping line - having a
positive slope. If the acceleration is negative, then the velocity-time graph
is a downward sloping line - having a negative slope. If the acceleration is
great, then the line slopes up steeply - having a large slope. The shape of the
line on the graph (horizontal, sloped, steeply sloped, mildly sloped, etc.) is
descriptive of the object's motion. This principle can be extended to any
motion conceivable. In this part of the lesson, we will examine how the
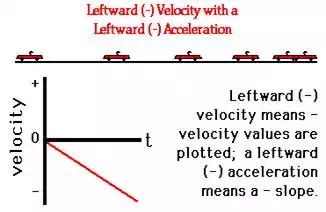
principle applies to a variety of types of motion. In each diagram below, a
short verbal description of a motion is given (e.g., "constant, rightward
velocity") and an accompanying motion diagram is shown.
Finally, the corresponding velocity-time graph is sketched and an explanation
is given. Near the end of this page, a few practice
problems are given.


