Constant Velocity versus Changing Velocity
Consider a car moving with a constant, rightward (+) velocity - say of +10 m/s. As learned in an earlier lesson, a car moving with a constant velocity is a car with zero acceleration.

 If the velocity-time data for such a car were graphed, then the
resulting graph would look like the graph at the right. Note that a motion
described as a constant, positive velocity results in a line of zero slope (a
horizontal line has zero slope) when plotted as a velocity-time graph.
Furthermore, only positive velocity values are plotted, corresponding to a
motion with positive velocity.
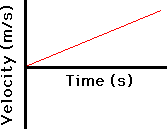
Now consider a car moving with a rightward (+), changing velocity - that is, a car that is moving rightward but speeding up or accelerating. Since the car is moving in the positive direction and speeding up, the car is said to have a positive acceleration.

 If the velocity-time data for such a car were graphed, then the
resulting graph would look like the graph at the right. Note that a motion
described as a changing, positive velocity results in a sloped line when
plotted as a velocity-time graph. The slope of the line is positive,
corresponding to the positive acceleration. Furthermore, only positive velocity
values are plotted, corresponding to a motion with positive velocity.
The velocity vs. time graphs for the two types of motion - constant velocity and changing velocity (acceleration) - can be summarized as follows.
|
Positive Velocity |
Positive Velocity |
|
|
|

