Probability Distributions Set 3 (Normal Distribution)
The previous two articles introduced two Continuous Distributions: Uniform and Exponential. This article covers the Normal Probability Distribution, also a Continuous distribution, which is by far the most widely used model for continuous measurement.
Introduction –
Whenever a
random experiment is replicated, the Random Variable that equals the average(or
total) result over the replicates tends to have a normal distribution as the
number of replicates becomes large.
It is one of the cornerstones of probability theory and statistics, because of
the role it plays in the Central Limit Theorem, and because many real-world
phenomena involve random quantities that are approximately normal (e.g., errors
in scientific measurement).
It is also known by other names such as- Gaussian Distribution, Bell
shaped Distribution.
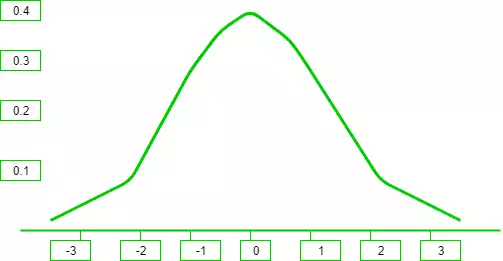
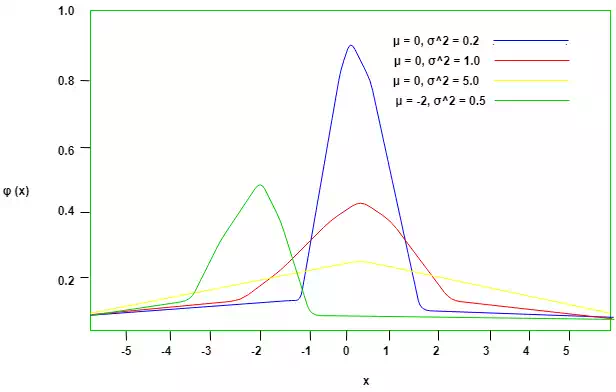
It can be observed from the above graph that the distribution is symmetric about its center, which is also the mean (0 in this case). This makes the probability of events at equal deviations from the mean, equally probable. The density is highly centered around the mean, which translates to lower probabilities for values away from the mean.
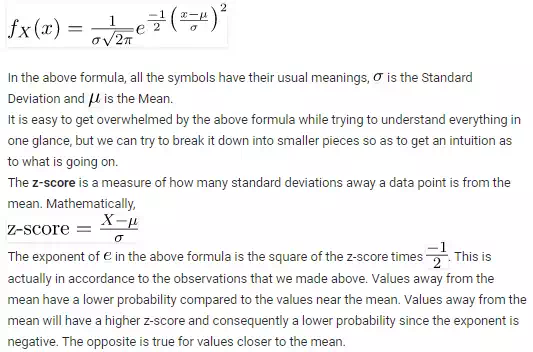
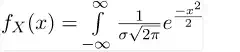
Probability Density Function –
The probability density function of the general normal distribution is given as-
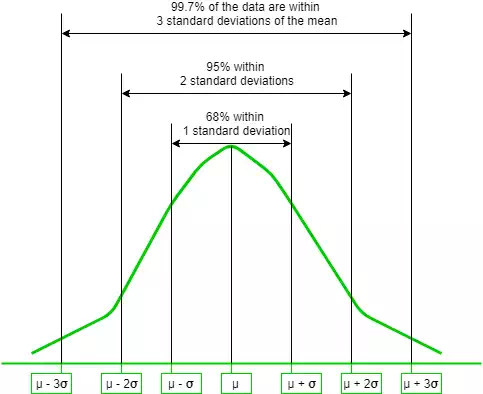
This gives way for the 68-95-99.7 rule, which states that the percentage of values that lie within a band around the mean in a normal distribution with a width of two, four and six standard deviations, comprise 68%, 95% and 99.7% of all the values. The figure given below shows this rule-
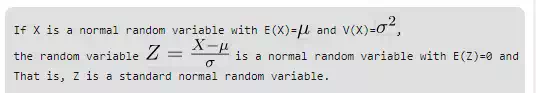
Standard Normal Distribution –
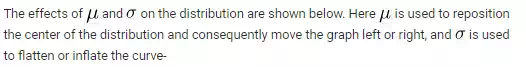
In the General Normal Distribution, if
the Mean is set to 0 and the Standard Deviation is set to 1, then the
corresponding distribution obtained is called the Standard Normal Distribution.
The Probability Density function now becomes-
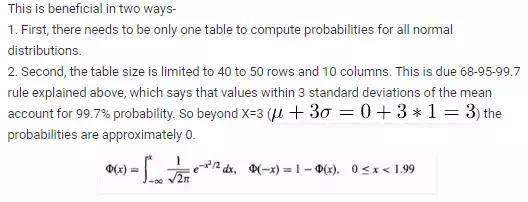
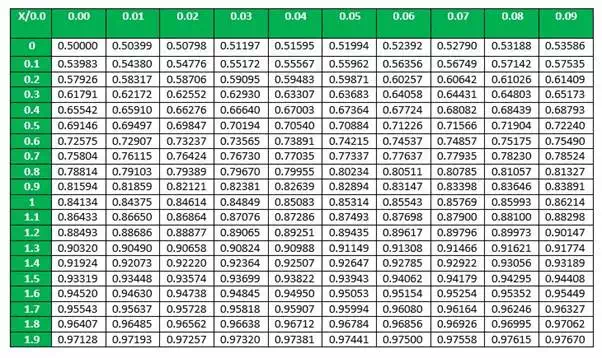
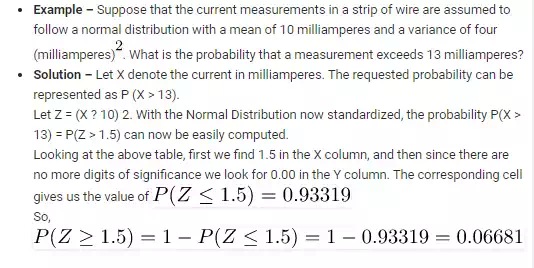
The cumulative density function of normal distribution does not give a closed formula. Hence precomputed values formulated in tables are used where-ever required. But these tables only contain data for the standard distribution. In order to find the cumulative probability for a general normal distribution, it is first standardized and then computed using the value tables.