Voltage Instability Monitoring
Phasor Measurement Units in
Power Grid Operations
With the
advent of time Phasor Measurement Units (PMU’s), the operations of power grid
controls is experiencing a paradigm shift as it transitions from a human
centric monitoring model to a data centric model. In a data-centric power grid,
fast transients can be tracked at high sampling rates of 20 times a second or
more. A phasor measurement unit (PMU) or synchrophasor is a device that
measures the electrical waves on an electricity grid using a common time source
for synchronization. Time synchronization allows synchronized real-time
measurements of multiple remote measurement points on the grid. PMUs typically
generate up to 4 Gb data per day.
These massive data sets from PMUs greatly exceed human capacity to analyze and comprehend trends in the data. They have also brought IT challenges to store, analyze, and transmit results without causing a bottleneck in the available information processing infrastructure. In addition to the amount of data, the dimensionality of synchrophasor data is bound to increase with more PMUs coming into operation. This sheer quantity of data requires the development of new predictive analytical tools that can help predict the onset of failures following disturbances or quantify how far the system is from the edge of a safe operating boundary without attempting to analyze all of the data at an atomic level.
Stability Analysis
An important
tool for Energy Management Systems (EMS) is stability analysis. However,
measurements from classic monitoring devices (i.e. SCADA devices) are not
synchronized which means that stability estimation is not very precise during
dynamic phenomena in the network. With the advent of real-time Phasor
Measurement Units (PMUs), synchronized phasor measurements are possible
allowing monitoring of dynamic phenomena. Existing methods for voltage
stability analysis are usually classified into static methods (such as Power-to-Voltage
curves) and dynamic methods (such as time domain simulation). The static
approaches are based on the steady-state power flow model of the power systems;
but because many aspects of voltage stability problems are due to phasing
issues not discoverable by steady state, such simplified approaches usually
lead to unreliable results. In order to get a much more realistic picture of
the voltage stability phenomena, it is necessary to take system dynamics into
account. On the other hand, the application of dynamic methods may be too
time-consuming for online use given the amounts of data generated from PMUs. To
resolve this issue, researchers have turned to a set of methods specifically
designed to analyze large data sets – artificial neural nets. Researchers have
been studying Artificial Neural Nets (ANNs) as a technique for PMU data
analysis for more than 10 years. Various techniques have been used to discover
models of given networks based on the large data sets generated, and to
maximize computational efficiency of those models by minimizing input
variables.
Artificial Neural Nets and
Voltage Stability
Significant
work has been done using ANNs as a means to develop high-performance stability
models for transmission networks. ANNs are of interest because they are capable
of discovering complex, non-linear relationships between sets of features in a
large data set which are used to build models of system behaviors. In the
voltage stability research, these models are represented as discovered algorithms
that calculate an output based on a set of computed features derived from a set
of inputs. The inputs can be pulled from among numerous measurements:
· Active & reactive power, measured at various points in the networks,
· Phase angles (for 3-phase power),
· Voltage magnitudes,
· Power wavelet transforms,
· Transmission line flows
· Etc.
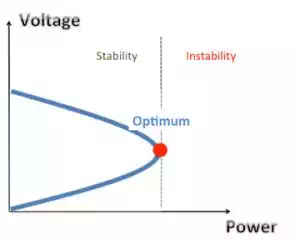
The feature sets are discovered using a variety of classification techniques. The models are determined by finding the best set of weights and features within the feature set that best predict the outputs based on training sample sets of data. The outputs are typically represented as a curve that represents the maximum voltage stability limit point beyond which the voltage can collapse. (See Figure)
Reduction of Features to Improve Performance
Measurements from the PMUs are very redundant and the number of variables can be extremely high. Restricting the input space to some subset of the available input variables has obvious performance benefits in terms of data storage, computational requirements, and cost of future data collection. Furthermore, reducing the number of input variables leads to better model understanding in some cases. The optimal input variable set will contain the fewest input variables required to describe all of the features used by the derived model from the ANN.
How does one determine this optimal set of input variables? One simple approach to find the optimal subset is to evaluate all possible combinations of the input variables. This approach may be feasible when the dimension of the input set is low, but as the dimension increases, it becomes unfeasible. Another solution is to use various classification techniques common in machine learning (ML). Research has been on-going to determine the best ML classification tool to derive the optimal set of inputs for ANN models. Among the techniques employed are:
· Support Vector Machines
· K-Nearest Neighbors
· Principal Component Analysis
· Multivariate Regression Analysis
· etc.
Data Cleanliness
The typical data
ingest process where data is gathered from multiple sources (loaded, cleaned,
linked, and analyzed) is both complex and resources intensive. It has been
observed that 60 to 80 percent of the effort in trying to analyze or mine data
happens in the extrapolate, transform, load (ETL) process. Traditional methods
of batch ETL fail to address the real-time needs around raw data from the PMU
that is constantly in flux. Complex event processing (CEP) combines data from
multiple sources to detect patterns and attempt to identify either
opportunities or threats. The goal is to identify significant events and
respond fast. Once the ANN derived model is constructed, the data patterns from
CEP can be fed into the model in real-time to determine when points in the transmission
network are stable or instable, providing a heretofore unavailable tool for
power transmission and distribution companies to detect outages sooner.
Although PMUs provide the opportunity for power engineers to more finely
discern potential interruptions in the grid, the sheer quantity of data output
from PMUs challenges current monitoring capabilities. Research into the
use of neural nets, and other ML techniques, provides a potential solution to
overcome the challenges with massive amounts of data.