Make an EFM8-Based System for Monitoring and Analyzing Thermocouple Measurements
With this microcontroller-to-PC interface you can conveniently monitor a temperature and visualize how the temperature changes over time.
In this project, we will develop a system for monitoring and recording thermocouple temperature measurements. You could certainly utilize this system for whatever sort of temperature sensing you choose to perform, but I do have a specific application in mind: the reflow toaster oven. You may or may not be aware that it is quite possible to solder surface-mount parts onto a PCB by pressing an ordinary toaster oven into service for reflow soldering. If you have ever looked into the cost of sending out two or three PCBs for professional assembly, you fully understand the importance of this low-cost do-it-yourself alternative.
One of the difficulties with the toaster oven approach, however, is temperature control. First, there is no guarantee that the oven’s temperature setting is sufficiently accurate (it was, after all, designed for food preparation, not PCB assembly). Second, optimal reflow soldering is not just about a single temperature. Consider the following:

This is the temperature profile recommended for a leaded solder paste manufactured by Kester. It is perhaps true that do-it-yourself assembly technicians don’t need to stress out about rigid adherence to temperature profiles, but your chances of consistent success certainly increase in proportion to how well you can replicate the recommended profile. Also, recording your temperature variations—even if you don’t attempt to fine-tune your oven’s performance—could help you to identify potential problems. For example,ChipQuick recommends a higher max temperature (235°C vs. 225°C) for its leaded product, and ChipQuick’s lead-free paste calls for a significantly higher peak temperature and a modified profile. Thus, if you notice that one type of paste works better than another, your temperature data might help you to sort out the problem.
A thermocouple is composed of two dissimilar metals (or semiconductors). These metals are formed into a junction at the temperature-sensing end.

Because of a phenomenon known as the Seebeck effect, a temperature gradient between two separate portions of the thermocouple will generate a voltage that can be measured and used to calculate the temperature at the thermocouple’s junction.
Thermocouples are classified according to the materials of which they are constructed. The variety used in this project—namely, K-type—is a common, general-purpose thermocouple with good accuracy and a wide temperature range.
In this project we will gather data from our thermocouple with the help of the PmodTC1 module, which is little more than a breakout board for the MAX31855 “cold-junction compensated thermocouple-to-digital converter.” As the name implies, this IC interfaces directly to the thermocouple and outputs the measured temperature as a binary number.


If you are wondering what “cold-junction compensation” is, recall that the thermocouple actually indicates the temperature difference between its junction and some other point along the thermocouple wires. Thus, to determine the absolute temperature at the junction, the MAX31855 measures its own die temperature and factors this into its calculations. This approach assumes that the IC’s die temperature is very similar to the temperature of the thermocouple’s “cold junction,” i.e., the junction where the induced voltage is measured. This is a safe assumption as long as the IC does not dissipate enough power to significantly increase its own temperature.
The MAX31855 uses a standard SPI (serial peripheral interface) bus to transfer temperature data to an external controller. The necessary interface signals, along with power and ground, are brought out to a 0.1-inch single-row header on the PmodTC1 module.
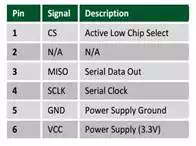
The PmodTC1 provides ±2°C accuracy with 0.25°C resolution, and with the included K-type thermocouple it can measure temperatures from -73°C to 482°C. For details on how to interpret the 14-bit temperature data, see the “Firmware” section below.
Here is the port I/O diagram from Simplicity Studio's hardware configurator:
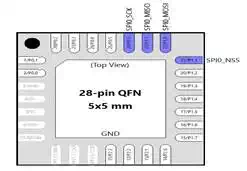
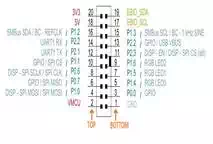
The only pins we need are the SPI signals: SCK (serial clock), MISO (master in slave out), and NSS (slave select). MOSI (master out slave in) is automatically routed to a port pin when we enable the SPI peripheral in the crossbar, but we don’t use it in this project because we don’t need to send any data to the MAX31855. SCK and NSS are configured as outputs and MISO is an input. Note that P0.0 through P0.5 are skipped by the crossbar so that the SPI signals are routed to the corresponding pins on the EFM8 board’s expansion header:
The SPI configuration is as follows:
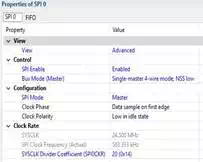
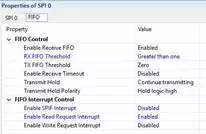
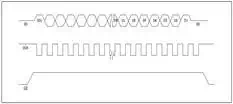
As indicated in the FIFO configuration, the SPIF (i.e., end-of-byte) interrupt is disabled and the FIFO read request interrupt is enabled. This means that the SPI interrupt service routine will not be called until there are enough bytes in the SPI FIFO buffer. The “RX FIFO Threshold” field is set to “greater than one,” meaning that the interrupt will fire once we have two received bytes in the FIFO. All of this configuration is designed to ensure that the EFM8’s SPI is compatible with the interface protocol in the MAX31855’s datasheet (in this project we need only the first 14 bits of this 32-bit transmission):
Important: For some reason (presumably a bug), Simplicity Studio does not incorporate the SPI FIFO settings into the InitDevice.c source file. Consequently, it is necessary to “manually” configure two SPI registers; this is accomplished with the following code:
//call hardware
initialization routine
enter_DefaultMode_from_RESET();
SFRPAGE = SPI0_PAGE;
//disable the normal (end-of-byte) SPI
interrupt
SPI0FCN1 &= ~SPI0FCN1_SPIFEN__BMASK;
//enable the receive FIFO interrupt
SPI0FCN0 |= SPI0FCN0_RFRQE__BMASK;
//set FIFO interrupt to fire when we
have more than one byte
SPI0FCN0 |= SPI0FCN0_RXTH__ONE;
//set slave select logic high (it is an
active-low signal)
SPI0CN0 |= NSS_BIT;
Scilab
We will use the following Scilab graphical user interface to collect and record temperature data:
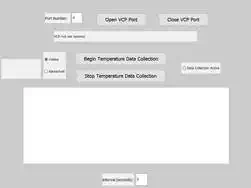
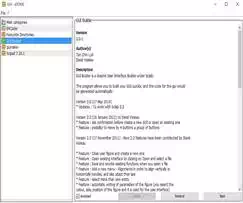
This GUI was designed with the help of the GUI Builder toolbox, which you can download through Scilab’s ATOMS module manager:
After you click “Begin Temperature Data Collection,” the GUI repeatedly sends temperature requests until you click “Stop Temperature Data Collection”; the interval between requests is determined by the number in the corresponding input box (below the plot window). The most recent temperature measurement is displayed in the text box adjacent to the Celsius and Fahrenheit radio buttons, and the temperature history is displayed in the plot window.
The overall functionality is as follows: The EFM8 sits idly waiting for a “request temperature data” command from the PC. When a command is received, the EFM8 transfers two SPI dummy bytes, thereby generating the 16 clock cycles needed to read in the temperature data from the MAX31855. When two bytes have been loaded into the SPI’s receive FIFO, an interrupt is generated. At this point the EFM8 repackages the 14-bit temperature data into a format that will be easy to handle in Scilab. At first glance the binary data coming from the MAX31855 seems a bit cryptic, so let’s take a closer look.
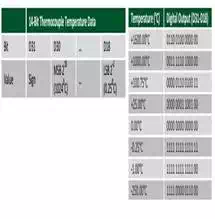
What we have here is a 14-bit two’s-complement number. The top 12 bits can be interpreted as a normal signed 12-bit number that directly corresponds to temperature in Celsius. (Note that currently the Scilab script is intended for processing only positive numbers.) The 2 lowest bits account for the MAX31855’s 0.25°C resolution: binary “00” for these two bits corresponds to zero in the decimal portion of the temperature; “01” corresponds to 0.25; “10” corresponds to 0.50; and “11” corresponds to 0.75. Also, don’t forget that the EFM8’s SPI bus works in units of bytes, not bits. The two bytes we read from the SPI FIFO will form a 16-bit number; the top 14 bits are the temperature data, and the lower two bits can be ignored. The following code shows how we convert this data into a three-byte message that will be sent to Scilab:
SI_INTERRUPT
(SPI0_ISR, SPI0_IRQn)
{
unsigned int RawTempData;
//clear
interrupt flag
SPI0FCN1 &=
~SPI0FCN1_RFRQ__BMASK;
RawTempData = SPI0DAT;
RawTempData = (RawTempData << 8) |
SPI0DAT;
//flush Rx
FIFO and disable slave select
SPI0FCN0 |= SPI0FCN0_RFLSH__FLUSH;
SPI0CN0 |= NSS_BIT;
/* The
following instructions convert the raw
* binary temperature data into
a format that
* can be easily interpreted
by Scilab. Refer to
* the text of the article for
more information.*/
TempDataTx[0] =
LOWBYTE(RawTempData >> 12);
TempDataTx[1] =
LOWBYTE(RawTempData >> 4);
switch((RawTempData &
(BIT3|BIT2)) >> 2)
{
case 0: TempDataTx[2] = 0;
break;
case 1: TempDataTx[2] = 25;
break;
case 2: TempDataTx[2] = 50;
break;
case 3: TempDataTx[2] = 75;
break;
}
TEMP_DATA_READY = TRUE;
}

We get the high byte by shifting the 16-bit number 12 bits to the right, and we get the low byte by shifting 4 bits to the right. We then convert the remaining two bits into an integer representing the decimal portion, and Scilab simply divides this integer by 100 and adds the result to the non-decimal portion.
The first plot is simply a measurement of indoor air temperature. Notice the minor variations.
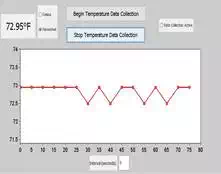
This plot shows the temperature profile for a standard-size oven set to 350°F:
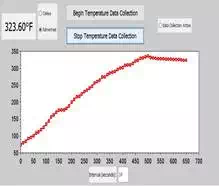
Notice the large discrepancy in the final temperature. Presumably this is due to both the inaccuracy of the oven’s temperature sensor and the difference in position between our thermocouple and the oven’s sensor.
Even if you are not ready for toaster oven reflow, this system could still be useful for monitoring and fine-tuning temperature while soldering with a hot-air gun. This video (running at 8x normal speed) shows temperature variations recorded while a thermocouple wedged between an IC pin and the PCB surface is heated up by a hot-air soldering gun set to the middle of its temperature range; the hot-air gun is removed at about 130 seconds.
https://youtu.be/TW_HUej79-Y