Mechanism
Flow-sensitive images show increased perfusion with stimulation, while blood oxygenation–sensitive images show changes consistent with an increase in venous blood oxygenation. Although the precise biophysical mechanisms responsible for the signal changes have yet to be determined, good hypotheses exist to account for our observations.
Two fundamental MRI relaxation rates, T1 and T2, are used to describe the fMRI signal. T1 is the rate at which the nuclei approach thermal equilibrium, and perfusion change can be considered as an additional T1 change. T2 represents the rate of the decay of MRI signal due to magnetic field inhomogeneities, and the change of T2 is used to measure blood-oxygenation change.
T2 changes reflect the interplay between changes in cerebral blood flow, volume, and oxygenation. As hemoglobin becomes deoxygenated, it becomes more paramagnetic than the surrounding tissue and thus creates a magnetically inhomogeneous environment. The observed increased signal on T2-weighted images during activation reflects a decrease in deoxyhemoglobin content, that is, an increase in venous blood oxygenation. Oxygen delivery, cerebral blood flow, and cerebral blood volume all increase with neuronal activation. Because CBF (and hence oxygen-delivery) changes exceed CBV changes by 2 to 4 times , while blood–oxygen extraction increases only slightly , the total paramagnetic blood deoxyhemoglobin content within brain tissue voxels will decrease with brain activation. The resulting decrease in the tissue-blood magnetic susceptibility difference leads to less intravoxel dephasing within brain tissue voxels and hence increased signal on T2-weighted images. These results independently confirm PET observations that activation-induced changes in blood flow and volume are accompanied by little or no increases in tissue oxygen consumption.
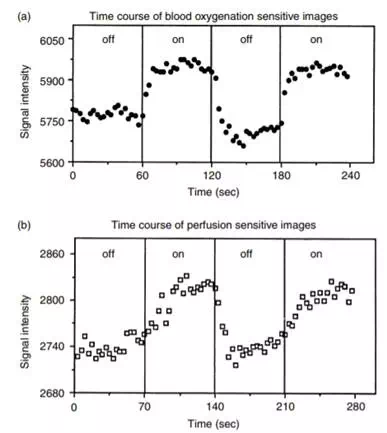
FIGURE 12.16 Signal intensity changes for a region of interest (∼60 mm2) within the visual cortex during darkness and during 8-Hz photic stimulation. Results using oxygenation-sensitive (top graph) and flow-sensitive (bottom graph) techniques are shown. The flow-sensitive data were collected once every 3.5 sec, and the oxygenation-sensitive data were collected once every 3 sec. Upon termination of photic stimulation, an undershoot in the oxygenation-sensitive signal intensity is observed.
Since the effect of volume susceptibility difference χ is more pronounced at high field strength , higher-field imaging magnets will increase the observed T2 changes. Signal changes can also be observed on T1-weighted MR images. The relationship between T1 and regional blood flow was characterized by Detre et al. :
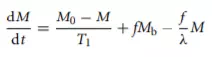
where M is tissue magnetization and Mb is incoming blood signal. M0 is proton density, f is the flow in ml/gm/unit time, and λ is the brain–blood partition coefficient of water (∼0.95 ml/g). From this equation, the brain tissue magnetization M relaxes with an apparent T1 time constant T1 app given by
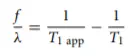
where the T1 app is the observed (apparent) longitudinal relaxation time with flow effects included. T1 is the true tissue longitudinal relaxation time in the absence of flow. If we assume that the true tissue T1 remains constant with stimulation, a change in blood flow f will lead to a change in the observed T1 app:
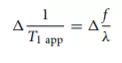
Thus the MRI signal change can be used to estimate the change in blood flow.
From Equation 12.14, if the magnetization of blood and tissue always undergoes a similar T1 relaxation, the flow effect would be minimized. This is a condition that can be approximated by using a flow-nonsensitive T1 technique inverting all the blood coming into the imaged slice of interest. This flow-nonsensitive sequence can be subtracted from a flow-sensitive T1 technique to provide an index of CBF without the need of external stimulation (Figure 12.19). Initial results with tumor patients show that such flow-mapping techniques are useful for mapping out blood flow of tumor regions.
Other flow techniques under investigation include the continuous inversion of incoming blood at the carotid level or the use of a single inversion pulse at the carotid level (EPIstar) inverting the incoming blood . Compared with the flow-nonsensitive and flow-sensitive methods, the bloodtagging techniques at the carotid level are basically similar concepts except that the MRI signal of tagged blood is expected to be smaller by a factor that depends on the time it takes blood to travel from the tagged site to the imaged slice of interest. The continuous-inversion technique also has a significant problem of magnetization transfer that contaminates the flow signal with a magnetization transfer signal that is several times larger. On the other hand, the advantage of the continuous inversion is that it can under optimal conditions provide a flow contrast larger than all the other methods by a factor of e.
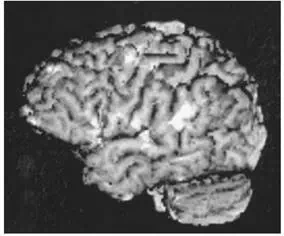
FIGURE 12.18 Left hemisphere surface rendering of functional data (EPI, gradient-echo, ten oblique coronal slices extending to posterior sylvian fissure) and high-resolution anatomic image obtained on a subject (age 33 years) during performance of a same-different (visual matching) task of pairs of words or nonwords (false font strings). Foci of greatest activation for this study are located in dominant perisylvian cortex, that is, inferior frontal gyrus (Broca’s area), superior temporal gyrus (Wernicke’s area), and inferior parietal lobule (angular gyrus). Also active in this task are sensorimotor cortex and prefrontal cortex. The perisylvian sites of activation are known to be key nodes in a left hemisphere language network. Prefrontal cortex probably plays a more general, modulatory role in attentional aspects of the task. Sensorimotor activation is observed in most language studies despite the absence of overt vocalization. (Courtesy of Dr. Randall Benson.)
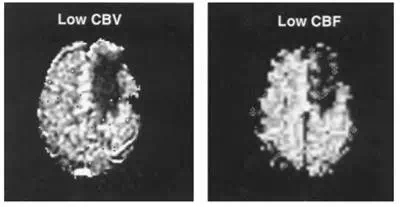
FIGURE 12.19 Functional MRI cerebral blood flow (CBF) index (right) of a low-flow brain tumor (dark region right of the midline) generated by the subtraction of a flow-nonsensitive image from a flow-sensitive image. This low-flow region matches well with a cerebral blood volume (CBV) map (left) of the tumor region generated by the injection of a bolus of MRI contrast agent Gd-DTPA, a completely different and established method to measure hemodynamics with MRI.
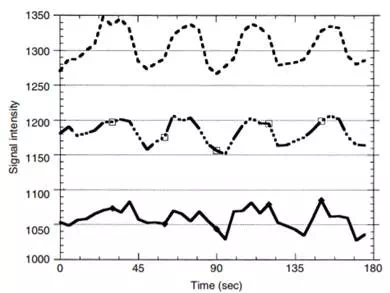
FIGURE 12.20 The curves represent time courses of MRI response to photic stimulation (off-on-off-on …) with different levels of velocity-dephasing gradients turned on to remove MRI signals coming from the flowing blood of large vessels. The top curve had no velocity-dephasing gradients turned on. The bottom curve was obtained with such strong velocity-dephasing gradients turned on that all large vessel signals were supposed to have been eliminated. The middle curve represents a moderate amount of velocity-dephasing gradients, a tradeoff between removing large vessel signals and retaining a reasonable amount of MRI signal to noise.