BLAST-P Results Part 1
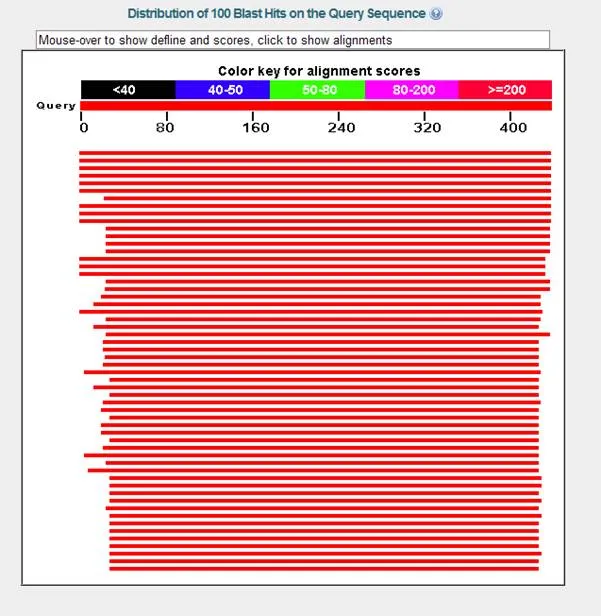
The blastp results page shows around 100 "Hits" , or sequences showing at least some similarity to corn alpha-amylase (when the tutorial was created). The illustration with the red bars is a diagrammatic representation of how your sequence (the top red bar) lines up with other sequences in the database along the primary structure of the protein (from 0 to over 400 amino acids). Note that some of the sequences lack the amino terminus of your corn alpha-amylase sequence.
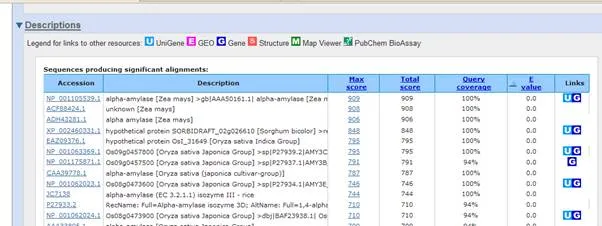
Once your results appear in the live window, scroll down past the red diagram and you will see a list of accession numbers and descriptors for sequences in order of decreasing similarity to your sequence. In fact, the first item in the list is (or should be) your sequence (check the accession number to be sure). The two scores at the right indicate the degree of similarity. Both are defined in the glossary of terms in this tutorial. You can click on any of these sequences to go to the GenPept page that describes it.
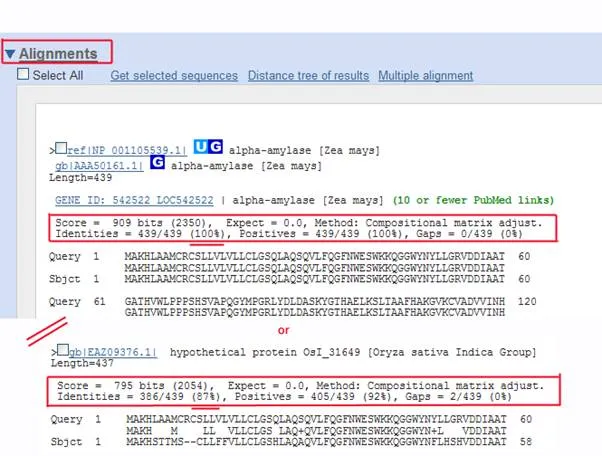
For now, scroll down to the "Alignment" section of the results to see the actual amino acid sequences aligned against yours (illustrated in the screen shot below). Note the amino acid identities to get a measure of how similar the sequences are. The first should be 100 % since it is the identical sequence. As you scroll down through the next several sequences, though, the percent identity should get smaller.