TURNING MOMENT DIAGRAM
The turning moment diagram (also known as crank-effort diagram) is the graphical representation of the turning moment or crank-effort for various positions of the crank. It is plotted on cartesian co-ordinates, in which the turning moment is taken as the ordinate and crank angle as abscissa
Turning Moment Diagram for a Single Cylinder Double Acting Steam Engine
A turning moment diagram for a single cylinder double acting steam engine is shown in Fig. 16.1. The vertical ordinate represents the turning moment and the horizontal ordinate represents the crank angle.
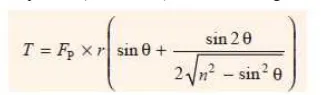
We have discussed in other Chapter (Art. 15.10.) that the turning moment on the crankshaft,
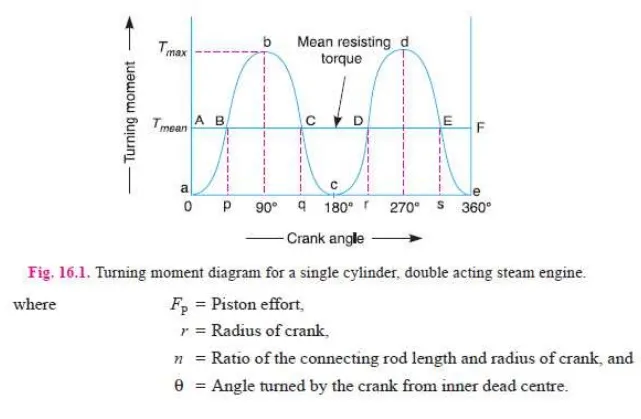
is maximum when the crank angle is 90° and it is again zero when crank angle is 180°.
This is shown by the curve abc in Fig. 16.1 and it represents the turning moment diagram for outstroke. The curve cde is the turning moment diagram for instroke and is somewhat similar to the curve abc.
Since the work done is the product of the turning moment and the angle turned, therefore the area of the turning moment diagram represents the work done per revolution. In actual practice, the engine is assumed to work against the mean resisting torque, as shown by a horizontal line AF. The height of the ordinate a A represents the mean height of the turning moment diagram. Since it is assumed that the work done by the turning moment per revolution is equal to the work done against the mean resisting torque, therefore the area of the rectangle aAFe is proportional to the work done against the mean resisting torque.
Turning Moment Diagram for a Four Stroke Cycle Internal Combustion Engine
A turning moment diagram for a four stroke cycle internal combustion engine is shown in Fig. 16.2. We know that in a four stroke cycle internal combustion engine, there is one working stroke after the crank has turned through two revolutions, i.e. 720° (or 4 π radians).

Fig. 16.2. Turning moment diagram for a four stroke cycle internal combustion engine.
Since the pressure inside the engine cylinder is less than the atmospheric pressure during the suction stroke, therefore a negative loop is formed as shown in Fig. 16.2. During the compression stroke, the work is done on the gases, therefore a higher negative loop is obtained. During the expansion or working stroke, the fuel burns and the gases expand, therefore a large positive loop is obtained. In this stroke, the work is done by the gases. During exhaust stroke, the work is done on the gases, therefore a negative loop is formed. It may be noted that the effect of the inertia forces on the piston is taken into account in Fig. 16.2.