SCADA software and tags
Supervisory control and data acquisition (SCADA) systems are designed to help an operators give commands, respond to alarms, generate reports, and undertake other actions on the plant floor. To achieve this, however, the operator must understand the two main parts of any SCADA software: the server and the client.
SCADA servers are responsible for core SCADA functions such as data communication with the control hardware (either directly or via an OPC server), graphics creation, alarm generation, security, data storage, reports generation, and other vital functions. The client is responsible for displaying the information gathered and generated by the SCADA server. The client also relayed operator commands to the SCADA server and displays trends and reports.
All SCADA server software comes with integrated client functionality. After programming and configuration is completed, the user has to switch to RUN mode and step aside. Additional client licenses are only required if there are two or more operating stations or if the plant manager wants to isolate the server.
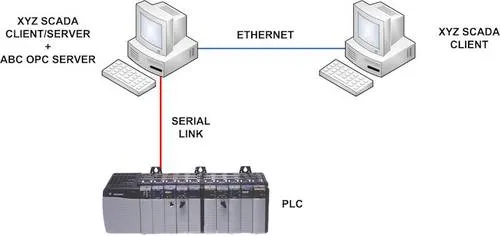
Most SCADA vendors provide two redundant servers; only a few provide triple redundancy capability. For clients, users can have as many as they want. The clients can be connected locally or remotely, or they can be connected via wide-area networks (WANs). They can even be connected over the Internet as Web clients (see figure 1).
Creating a SCADA program
After the XYZ SCADA server has been installed on the same PC and the software starts, click on "File, then "New project," and then the software shows a whole lot of stuff that looks like a giant mess rather than the menu-driven software that the user might have expected. Getting from what’s on the screen to the end result might seem overwhelming, but it’s a manageable situation. There are four key steps to the process.
Step 1: Define the connections
The SCADA server needs to know two things to connect to any device (or OPC server) for data read/write purposes:
In this example, OPC client, and software connection are chosen (see Figure 2).
Step 2: Define the data source
What is the slave/server address? It can be node address for serial; IP address for Ethernet; OPC server name; and host IP address in case of OPC. In this case, the OPC server name is ABC OPC, and the host IP is (local host), meaning it exists in the same computer as the SCADA software. [subhead]
Step 3: Define the tags
Tags are the placeholder of information in SCADA servers; they are similar to OPC items, except that internal tags (results of calculations made by SCADA scripts for example), as well as external tags (information from PLCs or OPC servers) can be used.
Every tag has three essential parameters:
Look for a place in the SCADA-configuration-named tags database, tags directory, tag management, or something similar. Create a new tag, enter the tag name as "TankTemp" and the address will be handled by the OPC server and the result will be something like what is shown here.
The data type will be real (floating point) or integer, depending on how the scaling was done and what data type was used in the OPC server.
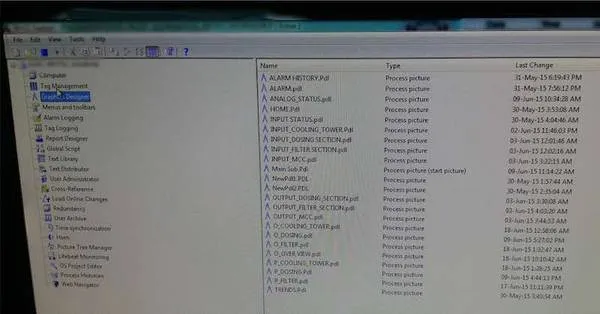
Step 4: Create the graphic displays
Now that the SCADA knows what information to get and how to get it, it’s time to display this information on the screen. Create a new graphics display, go to the symbols library, pick a tank symbol, and the gauge symbol and place them both on the screen.
Open the configuration of the gauge, look for a property named Data Source or Tag or something similar, and enter the tag name.
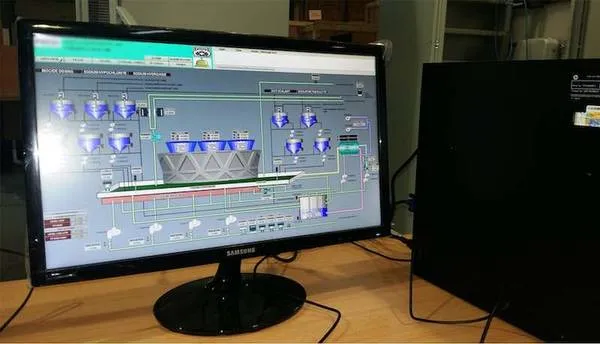
At this point, if the user runs SCADA software in the "run mode," the temperature gauge on the screen displays the tank temperature in real time.
Other SCADA system benefits
From that point, the sky is the limit for the possibilities the SCADA software can provide. Using the same TankTemp Tag, users can display it in numerous ways and generate various types of alarms that would alert the operator for abnormalities (limit crossing, deviation, rate of change, etc.). Users can also plot the temperature value against time along with other variables. Users can give the operator an insight to the process variability or periodically store the temperature value so the reports can be generated later.