Correlation and linear regression
Summary
Use linear regression or correlation when you want to know whether one measurement variable is associated with another measurement variable; you want to measure the strength of the association (r2); or you want an equation that describes the relationship and can be used to predict unknown values.
Introduction
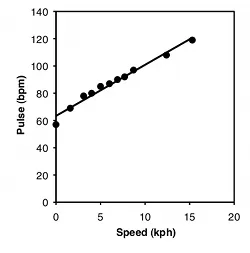
One of the most common graphs in science plots one measurement variable on the x (horizontal) axis vs. another on the y (vertical) axis. For example, here are two graphs. For the first, I dusted off the elliptical machine in our basement and measured my pulse after one minute of ellipticizing at various speeds:
Speed, kph | Pulse, bpm |
0 | 57 |
1.6 | 69 |
3.1 | 78 |
4 | 80 |
5 | 85 |
6 | 87 |
6.9 | 90 |
7.7 | 92 |
8.7 | 97 |
12.4 | 108 |
15.3 | 119 |
Graph of my pulse rate vs. speed on an elliptical exercise machine.
For the second graph, I dusted off some data from McDonald (1989): I collected the amphipod crustacean Platorchestia platensis on a beach near Stony Brook, Long Island, in April, 1987, removed and counted the number of eggs each female was carrying, then freeze-dried and weighed the mothers:
Weight, mg | Eggs |
5.38 | 29 |
7.36 | 23 |
6.13 | 22 |
4.75 | 20 |
8.10 | 25 |
8.62 | 25 |
6.30 | 17 |
7.44 | 24 |
7.26 | 20 |
7.17 | 27 |
7.78 | 24 |
6.23 | 21 |
5.42 | 22 |
7.87 | 22 |
5.25 | 23 |
7.37 | 35 |
8.01 | 27 |
4.92 | 23 |
7.03 | 25 |
6.45 | 24 |
5.06 | 19 |
6.72 | 21 |
7.00 | 20 |
9.39 | 33 |
6.49 | 17 |
6.34 | 21 |
6.16 | 25 |
5.74 | 22 |
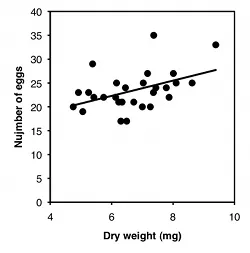
Graph of number of eggs vs. dry weight in the amphipod Platorchestia platensis.
There are three things you can do with this kind of data. One is a hypothesis test, to see if there is an association between the two variables; in other words, as the X variable goes up, does the Y variable tend to change (up or down). For the exercise data, you'd want to know whether pulse rate was significantly higher with higher speeds. The P value is 1.3×10⁻⁸, but the relationship is so obvious from the graph, and so biologically unsurprising (of course my pulse rate goes up when I exercise harder!), that the hypothesis test wouldn't be a very interesting part of the analysis. For the amphipod data, you'd want to know whether bigger females had more eggs or fewer eggs than smaller amphipods, which is neither biologically obvious nor obvious from the graph. It may look like a random scatter of points, but there is a significant relationship (P=0.015).
The second goal is to describe how tightly the two variables are associated. This is usually expressed with r, which ranges from −1 to 1, or r2, which ranges from 0 to 1. For the exercise data, there's a very tight relationship, as shown by the r2 of 0.98; this means that if you knew my speed on the elliptical machine, you'd be able to predict my pulse quite accurately. The r2 for the amphipod data is a lot lower, at 0.21; this means that even though there's a significant relationship between female weight and number of eggs, knowing the weight of a female wouldn't let you predict the number of eggs she had with very much accuracy.
The final goal is to determine the equation of a line that goes through the cloud of points. The equation of a line is given in the form Ŷ=a+bX, where Ŷ is the value of Y predicted for a given value of X, a is the Y intercept (the value of Y when X is zero), and b is the slope of the line (the change in Ŷ for a change in X of one unit). For the exercise data, the equation is Ŷ=63.5+3.75X; this predicts that my pulse would be 63.5 when the speed of the elliptical machine is 0 kph, and my pulse would go up by 3.75 beats per minute for every 1 kph increase in speed. This is probably the most useful part of the analysis for the exercise data; if I wanted to exercise with a particular level of effort, as measured by pulse rate, I could use the equation to predict the speed I should use. For the amphipod data, the equation is Ŷ=12.7+1.60X. For most purposes, just knowing that bigger amphipods have significantly more eggs (the hypothesis test) would be more interesting than knowing the equation of the line, but it depends on the goals of your experiment.
When to use them
Use correlation/linear regression when you have two measurement variables, such as food intake and weight, drug dosage and blood pressure, air temperature and metabolic rate, etc.
There's also one nominal variable that keeps the two measurements together in pairs, such as the name of an individual organism, experimental trial, or location. I'm not aware that anyone else considers this nominal variable to be part of correlation and regression, and it's not something you need to know the value of—you could indicate that a food intake measurement and weight measurement came from the same rat by putting both numbers on the same line, without ever giving the rat a name. For that reason, I'll call it a "hidden" nominal variable.
The main value of the hidden nominal variable is that it lets me make the blanket statement that any time you have two or more measurements from a single individual (organism, experimental trial, location, etc.), the identity of that individual is a nominal variable; if you only have one measurement from an individual, the individual is not a nominal variable. I think this rule helps clarify the difference between one-way, two-way, and nested anova. If the idea of hidden nominal variables in regression confuses you, you can ignore it.
There are three main goals for correlation and regression in biology. One is to see whether two measurement variables are associated with each other; whether as one variable increases, the other tends to increase (or decrease). You summarize this test of association with the P value. In some cases, this addresses a biological question about cause-and-effect relationships; a significant association means that different values of the independent variable cause different values of the dependent. An example would be giving people different amounts of a drug and measuring their blood pressure. The null hypothesis would be that there was no relationship between the amount of drug and the blood pressure. If you reject the null hypothesis, you would conclude that the amount of drug causes the changes in blood pressure. In this kind of experiment, you determine the values of the independent variable; for example, you decide what dose of the drug each person gets. The exercise and pulse data are an example of this, as I determined the speed on the elliptical machine, then measured the effect on pulse rate.
In other cases, you want to know whether two variables are associated, without necessarily inferring a cause-and-effect relationship. In this case, you don't determine either variable ahead of time; both are naturally variable and you measure both of them. If you find an association, you infer that variation in X may cause variation in Y, or variation in Y may cause variation in X, or variation in some other factor may affect both Y and X. An example would be measuring the amount of a particular protein on the surface of some cells and the pH of the cytoplasm of those cells. If the protein amount and pH are correlated, it may be that the amount of protein affects the internal pH; or the internal pH affects the amount of protein; or some other factor, such as oxygen concentration, affects both protein concentration and pH. Often, a significant correlation suggests further experiments to test for a cause and effect relationship; if protein concentration and pH were correlated, you might want to manipulate protein concentration and see what happens to pH, or manipulate pH and measure protein, or manipulate oxygen and see what happens to both. The amphipod data are another example of this; it could be that being bigger causes amphipods to have more eggs, or that having more eggs makes the mothers bigger (maybe they eat more when they're carrying more eggs?), or some third factor (age? food intake?) makes amphipods both larger and have more eggs.
The second goal of correlation and regression is estimating the strength of the relationship between two variables; in other words, how close the points on the graph are to the regression line. You summarize this with the r2 value. For example, let's say you've measured air temperature (ranging from 15 to 30°C) and running speed in the lizard Agama savignyi, and you find a significant relationship: warmer lizards run faster. You would also want to know whether there's a tight relationship (high r2), which would tell you that air temperature is the main factor affecting running speed; if the r2 is low, it would tell you that other factors besides air temperature are also important, and you might want to do more experiments to look for them. You might also want to know how the r2 for Agama savignyi compared to that for other lizard species, or for Agama savignyi under different conditions.
The third goal of correlation and regression is finding the equation of a line that fits the cloud of points. You can then use this equation for prediction. For example, if you have given volunteers diets with 500 to 2500 mg of salt per day, and then measured their blood pressure, you could use the regression line to estimate how much a person's blood pressure would go down if they ate 500 mg less salt per day.