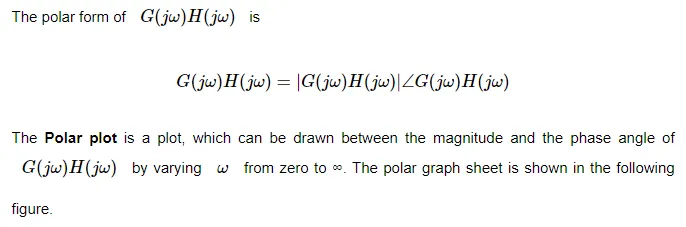
Polar Plots
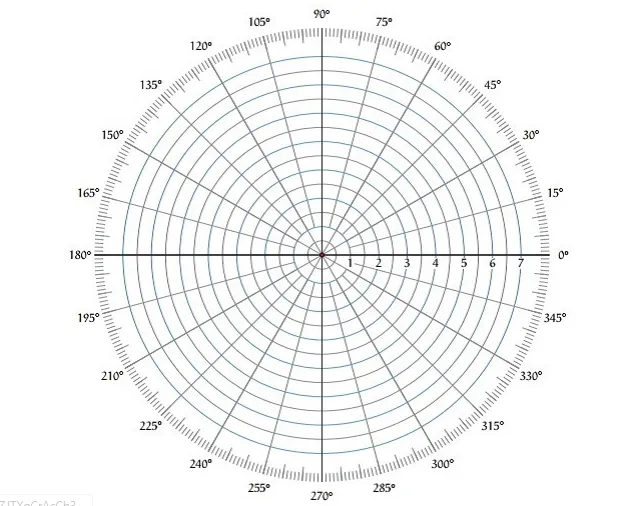
we have two separate plots for both magnitude and phase as the function of frequency. Let us now discuss about polar plots. Polar plot is a plot which can be drawn between magnitude and phase. Here, the magnitudes are represented by normal values only.