Bode Plots
The Bode plot or the Bode diagram consists of two plots −
In both the plots, x-axis represents angular frequency (logarithmic scale). Whereas, yaxis represents the magnitude (linear scale) of open loop transfer function in the magnitude plot and the phase angle (linear scale) of the open loop transfer function in the phase plot.
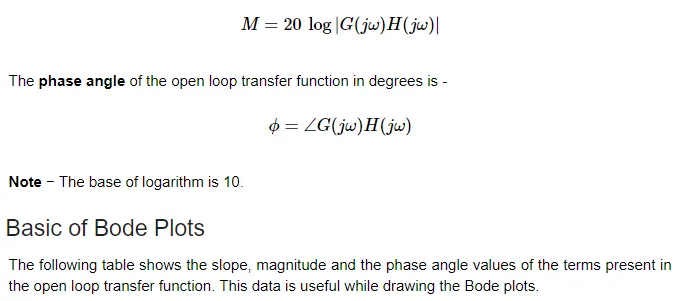
The magnitude of the open loop transfer function in dB is -