Cumulative plots
A cumulative plot is a way to draw cumulative information graphically. It displays the number / percentages, or proportion of observations that are less than or equal to particular value.
Example
Problem Statement:
Draw the frequency and comulative frequency plots of 10 student test scores based on following data.
|
Sr. No. |
Roll No. |
Test Score |
|
1 |
100 |
30 |
|
2 |
101 |
40 |
|
3 |
102 |
35 |
|
4 |
103 |
50 |
|
5 |
104 |
60 |
|
6 |
105 |
65 |
|
7 |
105 |
35 |
|
8 |
105 |
55 |
|
9 |
105 |
65 |
|
10 |
105 |
70 |
Solution:
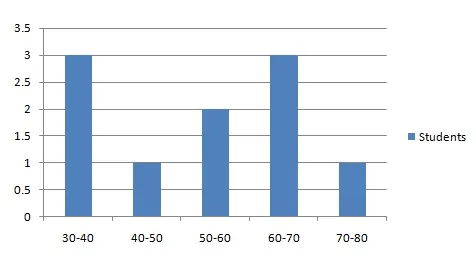
For the frequency chart, compute the frequecies as shown below. This table show the no. of students scoring in given ranges.
|
Sr. No. |
Frequency |
Students |
|
1 |
30-40 |
3 |
|
2 |
40-50 |
1 |
|
3 |
50-60 |
2 |
|
4 |
60-70 |
3 |
|
4 |
70-80 |
1 |
Following is the required frequency plot
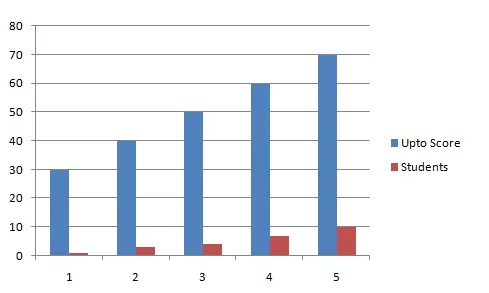
For the comulative frequency chart, compute the frequecies as shown below. This table show the no. of students scoring upto given marks(including).
|
Sr. No. |
Upto Score |
Students |
|
1 |
30 |
1 |
|
2 |
40 |
3 |
|
3 |
50 |
4 |
|
4 |
60 |
7 |
|
5 |
70 |
10 |
Following is the required frequency plot