Flow profiles
The water surface profile is a measure of how the flow depth changes longitudinally. The profiles are classified based on the relationship between the actual water depth (y), the normal depth (yn) and the critical depth(yc). Normal depth is the depth of flow that would occur if the flow was uniform and steady, and is usually predicted using the Manning's Equation. Critical depth is defined as the depth of flow where energy is at a minimum for a particular discharge.
Flow profiles are classified by the slope of the channel (So), yn, and yc. There are five slope classifications designated by the letters C, M , S, A, and H (critical, mild, steep, adverse, and horizontal) respectively.
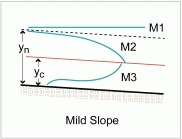
· Mild (M) if yn > yc
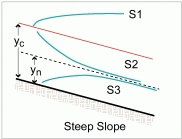
· Steep (S) if yn < yc
· Critical (C) if yn= yc
· Adverse (A) if So < 0 (if slope is positive in the downstream direction)
· Horizontal (H) if So = 0
The profile is further classified according to the relative position of the actual flow depth to normal and critical depth as designated by the numbers 1, 2, and 3.
· Type 1 curve: Actual depth is greater than yc and yn, flow is subcritical
· Type 2 curve: actual depth is between yc and yn, flow can be either subcritical or supercritical
· Type 3 curve: actual depth is less than both yc and yn, flow is supercritical.
Subcritical occurs when the actual water depth is greater than critical depth. Subcritical flow is dominated by gravitational forces and behaves in a slow or stable way. It is defined as having a Froude number less than one.
Supercritical flow is dominated by inertial forces and behaves as rapid or unstable flow. Supercritical flow transitions to subcritical through a hydraulic jump which represents a high energy loss with erosive potential. When the actual depth is less than critical depth it is classified as supercritical. Supercritical flow has a Froude number greater than one.
Critical flow is the transition or control flow that possesses the minimum possible energy for that flowrate. Critical flow has a Froude number equal to one.
Flow Profile Classification
|
Critical Slope is one that sustains uniform, critical flow (yn=yc). Critical flow is unstable and a small fluctuation in energy will shift the flow into supercritical or subcritical flow. |
|
|
Mild Slope is less than the critical slope and the normal depth is greater than critical depth (yn>yc). The flow is subcritical and controlled downstream. M1 profiles are common where mild slope streams enter a pool. M2 profiles can occur upstream of a sudden enlargement in a channel or where the slope becomes steeper.
|
|
|
Steep Slope is steeper than critical slope, normal depth is less than critical depth (yn<yc). The flow is supercritical and controlled upstream. S1 profiles begin with rise at the upstream end, then becomes horizontal, for example where a steep channel enters a pool. S2 is called a drawdown curve found at the downstream end of a channel enlargement. |
|