Surface Reflectance Characteristics and Snow Surface Variations from GNSS Reflected Signals
Nasser Najibi1, 2, 3 and Shuanggen Jin1
[1] Shanghai Astronomical Observatory, Chinese Academy of Sciences, Shanghai, China
[2] University of Chinese Academy of Sciences, Beijing, China
[3] The City University of New York, The City College of New York, New York, NY, USA
Introduction
Understanding the climate dynamics is one of the most concerns of human beings, especially in current global climate warming. The Global Positioning System (GPS) reflected signal has demonstrated to sense the Earth’s surface components since early 1990s. Later, a number of GPS remote sensing applications and experiments have been performed with demonstrating the ability of scattered and reflected GPS signals for soil moisture estimation [1], the vegetation growth [2] and forest biomass monitoring [3]. Furthermore, the snow depth and snow water equivalent (SWE) can be estimated recently from GPS signal to noise ratio (SNR) by [4] and [5]. Furthermore, [6] showed that the geometry free linear combination of GPS signals was able to estimate the snow depth with GPS reflected signals theories [7], while the SNR data is not always available in the raw GPS observations due to the limited capacity in data storage.
Here we intentionally focus on snow surface variations in Greenland Ice Sheet (GrIS) from ground GPS observations, because it is the second largest glacier in the world [8]. Thus, it has an important contribution to the global sea level changes [9] where the total surface accumulation for recent 30-year span is about 299±23 Kg.m-2/yr [10]. Besides, GrIS has very severe climatic conditions that make it very difficult to establish in-situ sensors for snow height and surface temperature at long time scales.
In this chapter, firstly, we introduce the theories and methodologies about reflectance characteristics of GPS reflected signals. Then, ionospheric geometric-free linear combination of GPS signals (GPS-L4) is estimated as a multi-path in order to characterize snow surface changes around ground GPS receivers, e.g., snow surface temperature (SST) and snow height (SH) variations. Furthermore, the non-parametric bootstrapping model is developed to link between GPS-L4 values and SH and SST, which is used to estimate SH and SST. In next parts, the methodologies and approaches used in this study are discussed. The study area and field observations are introduced and the results, discussions and conclusions are presented, respectively.
Reflectance characteristics
Sensing the targeted surface with reflectometry technique is determined by the polarization analysis of reflected signal’s chemical features and the geometric reflectivity of reflected signals. In electromagnetic literatures, the polarization of an electromagnetic signal is explained by the changes in orientation of the electric field vector where this vector is perpendicular to both the direction of travelling as well as the magnetic-based field vector [11]. Although the polarization feature can be defined as the geometric figure will be projected by the electric field vector on a static plane that is also perpendicular to the direction of propagation in which the signal would pass through that assumed plane [12]. More specifically, when the electromagnetic signals transmit from a physical space with a given refractive index n1 into a second space with refractive index n2, both reflection and refraction of the signals may happen [13-15].
The Fresnel equations developed in spectroscopy can be used to understand which signal fraction is reflected or refracted (i.e. transmitted). In reflectance characteristics, we are generally dealing with the surface chemical properties, in particular, the surface conductivity and relative permittivity. In addition, they can describe the phase shift of reflected signal [16].
In this study, the modeled snow is considered as a soft new snow with density of 127 kg/m3, approximately [17] as well as the employed ice is a pure ice with mean temperature between 0 and −10 °C [18]. Also, the soil surface is a dry bare soil with estimated relative permittivity of less than 8 percent [19]. Based on this, the numerical constant values for conductivity and relative permittivity related to snow, ice and soil surfaces employed in this work are given in Table 1.

It is worth mentioning that the conductivity values for modeled snow, ice and soil surfaces are considered as mean values of given constant values in Table 1.
In surface reflectance domain, the incident signal with the electric field located in the same plane of the interface is called s-polarized (Rs) signal. Similarly, the incident signal which its electric field is placed in a perpendicular direction with respect to the s-polarized signal, called p-polarized (Rp) signal. In fact, when an electromagnetic signal is traveling from a dense medium into a less dense one (i.e., n1 > n2), for a specified material, those angles larger than the incidence angle are recognized as the critical angles concerned to that material. When the entire signal is being reflected, thus, Rs=Rp=1. This phenomenon is defined as total internal reflection of that surface [13].
It is worth mentioning that the reflection coefficients (RC) for horizontal (RCH) and vertical (RCV) polarizations are as Eq. 1 and 2 [20]:

By Considering the GPS receiver antenna’s configuration that mostly can receive the Right-Hand Circular Polarization (RHCP) signals, it is necessary to assess these selected surfaces in cross-polarized and co-polarized cases [23]. According to [24], the co-polarization equation can be written as follows:

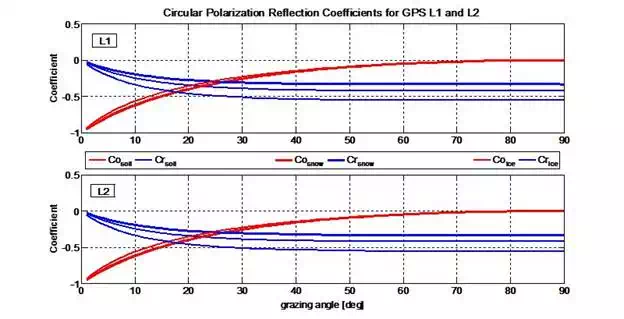
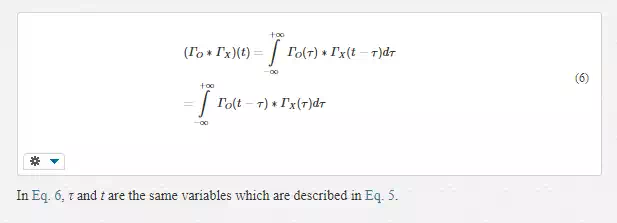
In Eq. 3 and Eq. 4, RCH and RCV denote the reflection coefficients for horizontal and vertical linear polarization, respectively, deduced from Eq. 1 and Eq. 2. Also, Гo and ГX are the reflection coefficients for co-polarization and cross-polarization. Thus, the reflection coefficients for GPS L1 and L2 signals with respect to the grazing angles will be derived by employing the GPS L1 and L2 signals as scatter signals towards the selected surfaces. It is necessary to assess the circular polarization reflectance characteristics in the desired surfaces that the corresponding optical polarization approaches presented in Eq. 1 to Eq. 4. The linear polarization is necessary to understand circular polarization used in related circular equations. Accordingly, the plots related to the co-polarized and cross-polarized signals are symmetrical, approximately (Fig. 1). In circular polarization, the Brewster angle is being recognized in the intersection point of co-polarization and cross-polarization plots (e.g., 27° for snow in GPS L1 signal). More importantly, since a reflected signal is correlated horizontally and vertically, the cross-correlation between vertical and horizontal components of each L1 and L2 signal is proposed to get the total surface reflectance from GPS signals. According to the electromagnetic singles properties [25], the cross-correlation equation will be the convolution of RCH and RCV signals. Thus, the convolution main function is defined as the integral-product of two functions after one is reversed and shifted. This particular integral transformation is given as follows:

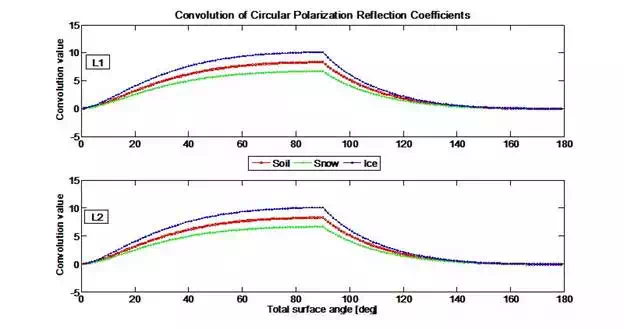
Accordingly, the selected surfaces in this study have different and special convolution values for linear polarization in the case of interacting with GPS L1 and L2 signals for the total angles in vertical and horizontal components (from 0 to 180 degrees). By considering both GPS L1 and L2 signals in linear polarization of convolution for snow, ice and soil surfaces, the cross-correlation polarization between co-polarized and cross-polarized of each L1 and L2 signal is happening in the convolution function of both polarizations. Since the entire reflected signal from the surface is correlated, the cross-correlation equation will be the convolution of Гo and ГX as the integral-product of two functions after one is reversed and shifted [23, 25], as follows:
GPS reflected signals
The GPS signals are RHCP that can be arrived at the GPS receiver via two different polarizations, including RHCP and LHCP. Although the GPS receivers are designed basically to obtain RHCP signals, but they can receive a low percentage of LHCP signals, which are coming mainly from the surroundings of the GPS receivers. If the incidence angle for a RHCP signal would be larger than the Brewster angle, the received signal by the GPS receiver will be as LHCP and vice versa. More importantly, the reflected signals from the surroundings of a GPS receiver are holding a time delay when they arrive at the GPS receiver antenna. According to this, if we consider the entire signals received by GPS receiver antenna as E, the scattered signals (emitted from GPS satellite and arrived at GPS receiver directly) with S and the reflected signals by R, the GPS observable at the time of t will be as follows:
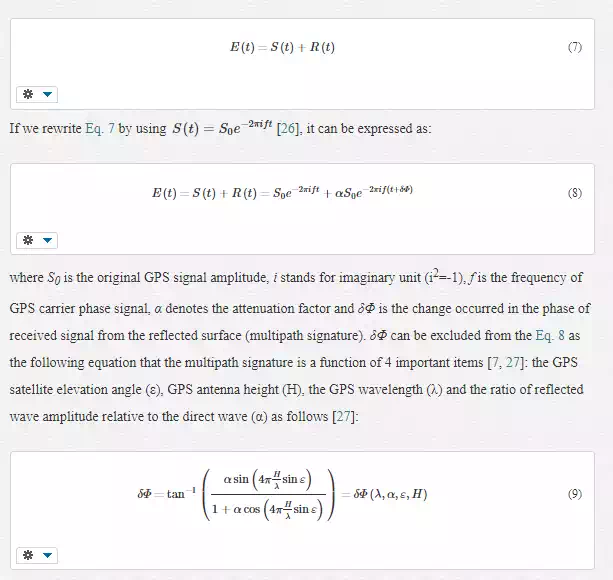
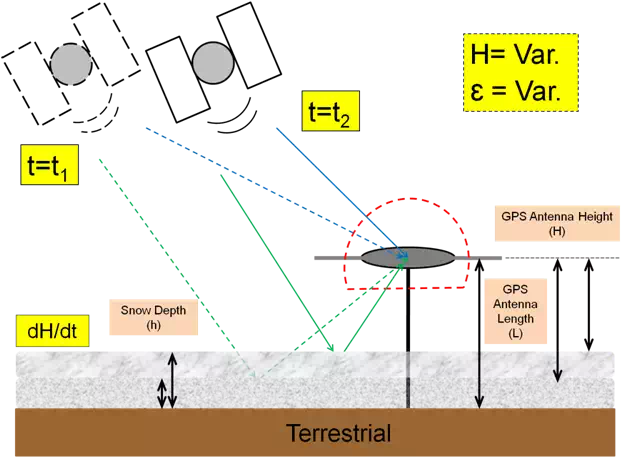
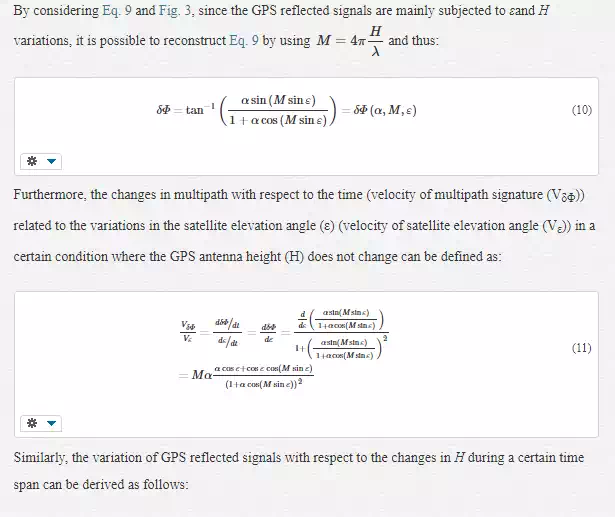
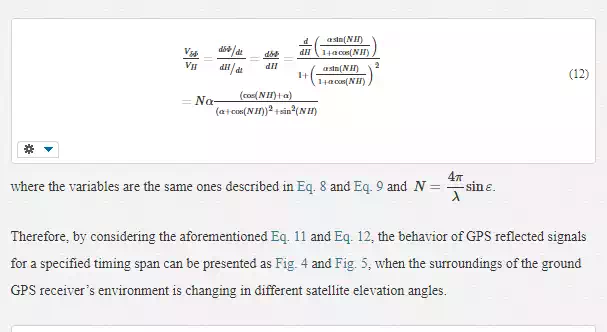
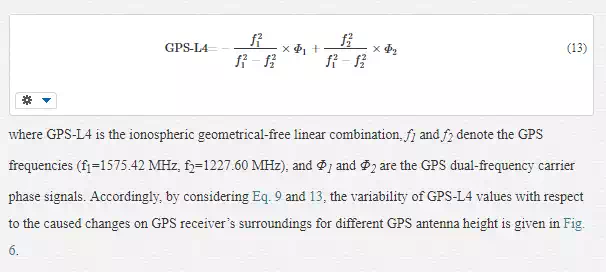
There are several methodologies for GPS observations (code pseudorange, carrier phase and Doppler) combinations and a suitable solution can be applicable for understanding. However, for GPS remote sensing purposes, using the ionospheric geometrical-free linear combination (GPS-L4) is more practical because in contrast to the Signal to Noise Ratio (SNR) data, GPS-L4 can be applied into any dual-frequency GPS receiver observations and eliminates the most effects of the ionosphere on the GPS signals. The GPS ionospheric-free geometrical linear combination of carrier phase signals is proposed as follows by [28, 29]:
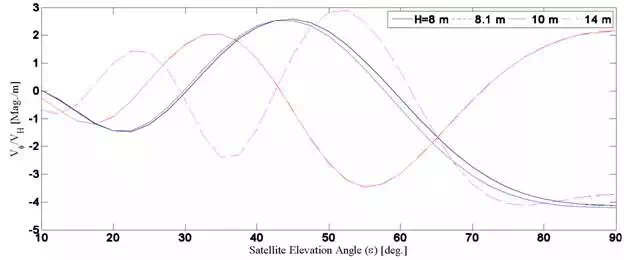
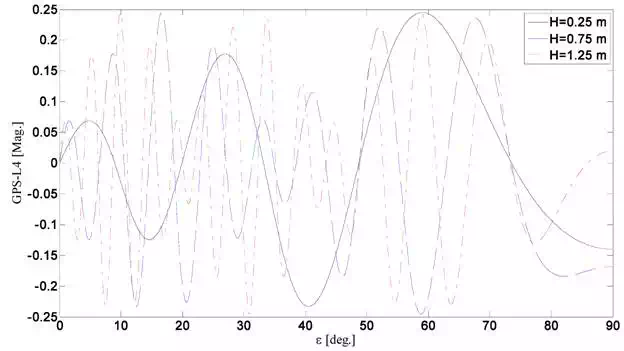
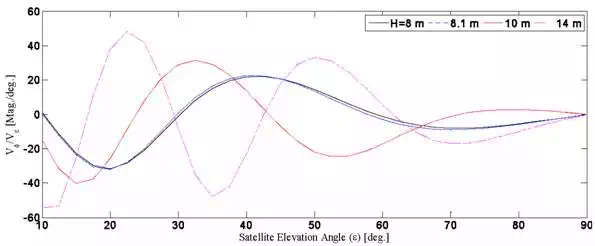
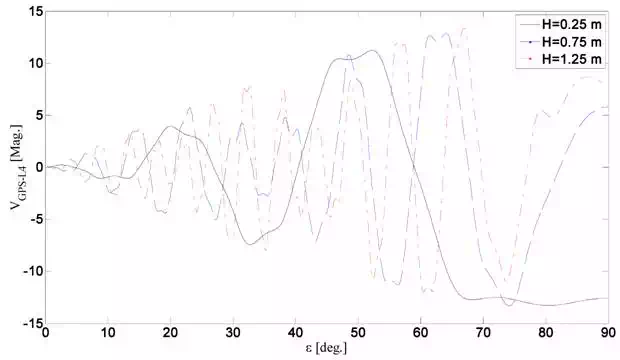
As it can be seen in Fig. 6, the amplitude of reflected GPS signals (here as GPS-L4) is increasing as the satellite elevation angle is enhancing. Furthermore, the frequency of GPS-L4 increases while the snow height is decreasing and vice versa. The latter statement is true since the reflected signals originated from lower satellite elevation angles are more powerful rather than those with higher elevations when they arrive at the GPS receivers from surroundings of the receivers. More importantly, the variability of GPS-L4 values is presented in Fig. 7. As it can be seen, the variability of GPS-L4 is increasing continuously as the satellite elevation angle enhances. Moreover, since a higher GPS antenna height makes it more redundant for the reflected signals the amplitude and also frequency of GPS-L4 variability are big for those lower snow heights in a certain satellite elevation angle
Results and discussion
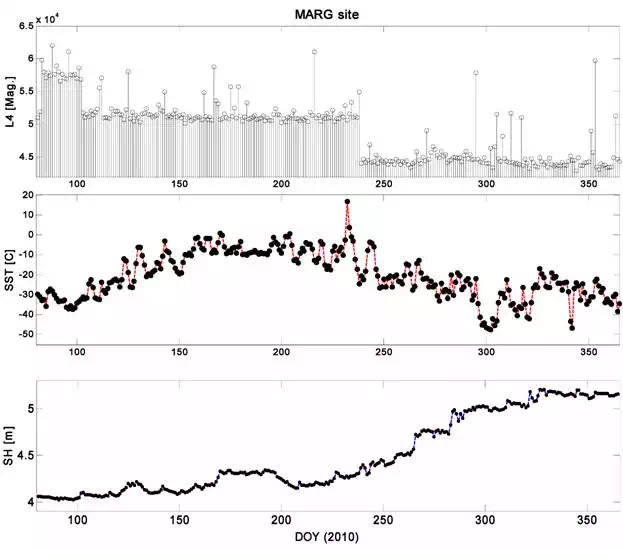
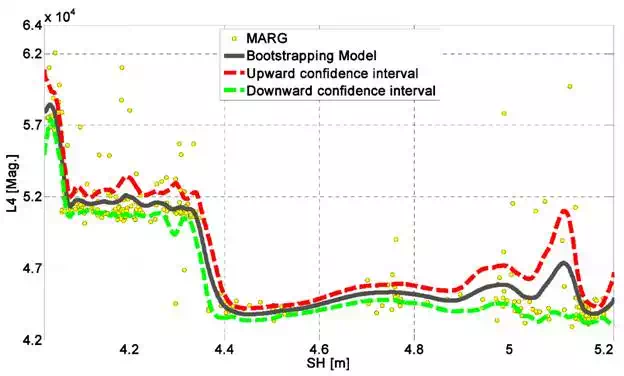
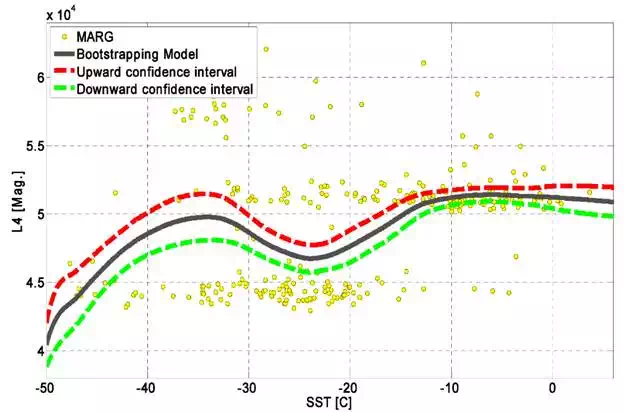
The Snow Height (SH), Snow Surface Temperature (SST) and GPS-L4 values are prepared as daily values at a co-located GPS and meteorological station, MARG (77.19 ºN and 65.69 ºW) in Greenland Ice Sheet (GrIS). MARG site has been equipped with a receiver type of AOA-BENCHMARK-ACT and the antenna type of TPSCR.G3. This ground GPS receiver can receive dual-frequency observations per 30 seconds continuously. Therefore, daily 2880-epoch observations for 32 satellites are used during 286 days from March 21, 2010 to December 31, 2010. The average daily GPS-L4 values from all the feasible observed satellites at MARG station are extracted. Furthermore, hourly SH and SST are observed at a meteorological station called GITS, which is a part of Greenland Climate Network Automated Weather Station (GC-NET-AWS) established by Cooperative Institute for Research in Environmental Sciences (CIRES), University of Colorado, Boulder, USA [30]. According to the metadata, the AWS station’s instruments are generally working based on World Meteorological Organization (WMO) standards. The distance between these two stations are about 115 km, but this meteorological station is the nearest one to the MARG GPS station. The mean daily SH (m) and mean SST (ºC) values are processed as average daily values. The daily values for GPS-L4 and observations for SH and SST are given in Fig. 8.
In order to model the relationship between SH, SST and GPS-L4 variations, the non-parametric bootstrapping model based on Fourier transform and local regression is proposed in Fig. 9 and Fig. 10. In fact, the model shows the most possible region that the GPS-L4 values and SH and SST can be placed in a direct proportion to each other.
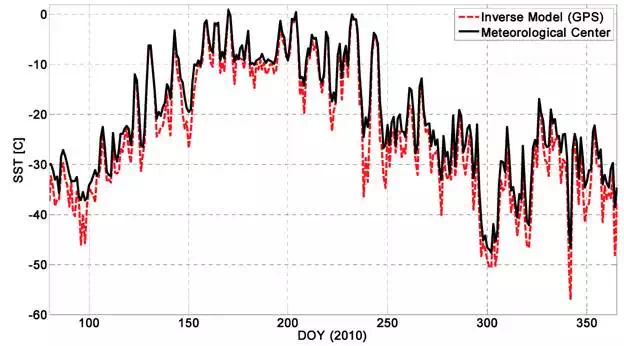
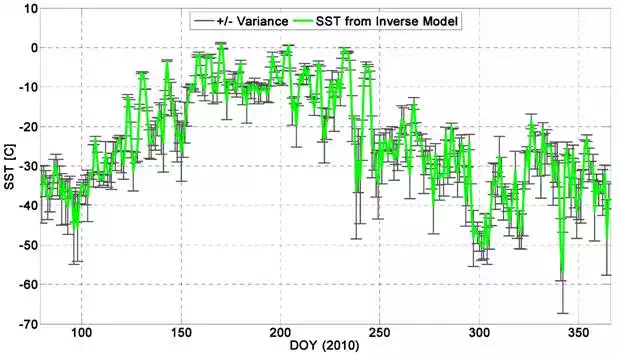
Moreover, the inverse model of bootstrapping model is employed to retrieve the SST values from GPS-L4 variations. Fig. 12 presents both the SST observation from the nearest meteorological station to the MARG GPS station and the SST values extracted from the inverse of bootstrapping model. The precision of outputs from the inverse of bootstrapping model depends on many factors; the homogeneity of SST and GPS-L4 distribution, the chosen confidence level (which here is considered as 63%) and the degree of freedom in Fourier approximations. The Pearson correlation coefficient between these two types of SSTs is 0.69 at this MARG site. As it can be seen in Fig. 11, there is a very good agreement between the resulted SST and the real SST values that observed in the meteorological center. The daily-related variance to SST values derived from the inverse of bootstrapping model is compared to the meteorological data as given in Fig. 12. The mean bias value for SST is about 3.8 ˚C in this timing span.
Conclusion
The aim of this study is to present GPS-Reflectometry applications to sense the SST and SH variabilities around the ground-based GPS receivers. The estimation of SST is possible by understanding the relationship between SH and SST using GPS reflected signals through GPS-L4 fluctuations at MARG site in GrIS during 286 days from March 21, 2010 to December 31, 2010. The results derived from the inverse of non-parametric bootstrapping model show that the estimated SST values have relatively a good accuracy and agreement with the real SST data. Moreover, the proposed non-parametric bootstrapping model has a good performance to connect the variability of GPS-L4 and SST values, indicating that the GPS reflected values can sense SST and SH variations on the snow-covered surfaces in high latitudes like Northern Canada and Greenland. However, it needs more works and experiments to further test in the future.
Summary
The reflected signals of Global Positioning System (GPS) are able to sense the Earth’s surface changes, such as snow depth, soil moisture and vegetation growth, particularly cryospheric remote sensing in hard condition, e.g., snow surface variations. In this chapter, the reflectance characteristics of reflected GPS signals from ionospheric geometrical free linear combination (GPS-L4) variations with respect to GPS antenna height and satellite elevation’s angle changes are presented. Snow surface variations are investigated using the reflected signals from ground-based GPS receiver in Greenland Ice Sheet (GrIS), including snow surface temperature (SST) and snow height (SH). The results illustrate that the average daily changes in the GPS multipath (GPS-L4) obtained from a dual-frequency GPS receiver at MARG site located in Greenland are affected by average daily SST and SH variations from March 21, 2010 to December 31, 2010. Additionally, the nonparametric bootstrapping model is developed with modeling the direct relation between GPS-L4 and SH and SST variabilities, which is then used to estimate SH and SST. The results indicate that the proposed model is applicable with the mean bias of 3.8 ˚C and 0.13 m for SST and SH at MARG site, respectively. Therefore, GPS multipath (L4) from ground-based GPS receiver has potential to sense snow surface variability.
This work is supported by Shanghai Science and Technology Commission Project (Grant No. 12DZ2273300), National Natural Science Foundation of China (NSFC) Project (Grant No. 11173050 and 11373059) and the Main Direction Project of Chinese Academy of Sciences (Grant No. KJCX2-EW-T03).
