Calibration of the GNSS Receivers — Methods, Results and Evaluation
Ta-Kang Yeh1
[1] Department of Real Estate and Built Environment, National Taipei University, New Taipei City, Taiwan
Introduction
GNSS (Global Navigation Satellite System) positioning technology has been utilized for surveying engineering, satellite geodesy and navigation in Taiwan. However, the performances of GNSS receivers need to correspond with the accuracy. In order to ensure the positioning precision and to correspond the ISO (International Organization for Standardization) requirement, the calibration of GNSS receivers are becoming more important [1]. The quality control and quality assurance standards of ISO 9000 emphasizes that the testing, measuring and verifying equipment (including testing software) should be controlled, calibrated and maintained [2]. Measuring equipment should have metrological characteristics as required for the intended use (for example accuracy, stability, range and resolution) [3]. ISO/IEC Guide 17025 states that the laboratory report should cover the uncertainty of calibration and testing results [4]. To ensure the measurement quality for ISO requirement, the traceability of calibration has been important to many fields of applications. In Taiwan, the GNSS calibration system has already been constructed by NML (National Measurement Laboratory, Taiwan) to provide calibration services for GNSS receivers. The ISO method [5] is adopted to calculate the uncertainty of the GNSS calibration system for describing the calibration results.
GNSS measurement system
The GNSS calibration network is composed of ultra-short baselines. The coordinates of calibration base points referred to the reference frame of ITRF (International Terrestrial Reference Frame). The distances of standard baselines and coordinates of calibration base points of ITRF are analyzed by GNSS positioning units, they are described as follows:
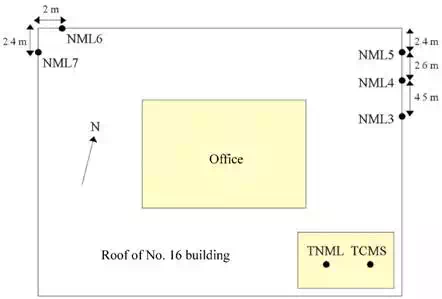
The field of ultra-short calibration baseline of GNSS receiver is located on the roof of building 16th of Industrial Technology Research Institute. There are two IGS (International GNSS Service) permanent stations TNML and TCMS operating continuously and five calibration base points called NML3, NML4, NML5, NML6 and NML7. Relative layout is as below in Figure 1. The appearance of permanent stations of TNML and TCMS are as Figure 2a, and appearance of calibration base points NML3 & 4 & 5 are as Figure 2b. The antennas are set up at stations with forced centering devices on every pillar.
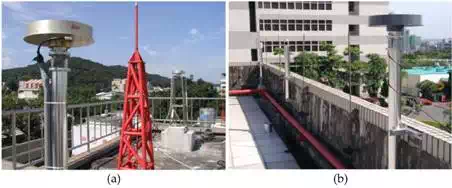
GNSS positioning units include: (a) Precise positioning GNSS receiver AOA BenchMark with accuracy 2 mm + 0.002 × 10⁻⁶ × D, D is distance. (b) GNSS receiver Leica RS500 with accuracy 3 mm + 0.5 × 10⁻⁶ × D, D is distance. (c) GNSS receiver Ashtech Z-Surveyor with accuracy 5 mm + 1 × 10⁻⁶ × D, D is distance [6]. Chock-ring antenna which can reduce multi-path effect. Precise instrument MET3A meteorological unit record temperature, relative humidity and pressure automatically. With those units can be improved the accuracy of GNSS positioning [7]. Moreover, the static relative positioning of middle distance, we chose TWTF as a base station which is maintained by the NSTFL (National Standard Time and Frequency Laboratory, Taiwan).
GNSS positioning is using known coordinates of satellites to calculate the distances from satellites to receivers and using the distances to calculate the unknown coordinates. Using time measurements can determinate the pseudo range from satellites to receivers, or using phase ambiguity can determinate the distances that carriers passed by. Coordinates of satellites can have from broadcast orbits from GNSS satellites signal, or download higher precision satellites ephemeris from IGS website [8]. Moreover, the Bernese version 5.0 software, which is developed by AIUB (Institute of Astronomy, University of Berne) to calculate the 3D coordinates.
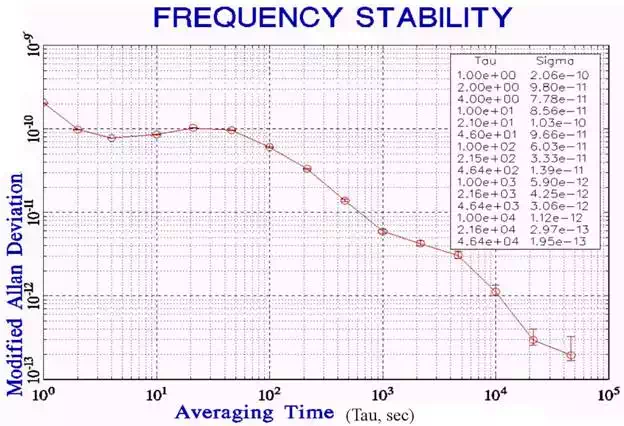
The AOA BenchMark GNSS receiver is adopted at station TNML and its internal frequency is traced to the NSTFL. The frequency stability, expressed as a modified Allan deviation in Figure 3. The results of time offset was around 7.1×10⁻⁹ second and frequency offset was 4.9 × 10⁻¹⁴ after linear analyzing.. The frequency stability of the external rubidium oscillator is approximately at the 10−13 level [9].
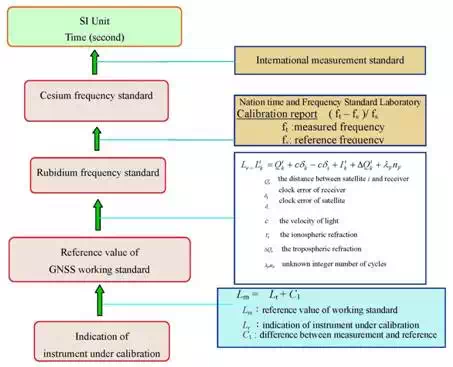
The main function of the GNSS calibration network is to determine the referential ITRF coordinates. Figure 4 presents the traceability chart and the ITRF coordinates are determined by GNSS positioning units.
Calibration procedure and methods
PRELIMINARY OPERATION
· The instrument under calibration (IUC) should include the operation menu, power supply, battery, and the charger.
· Check the battery of the IUC. If the power is insufficient, charge the battery according to the operation menu.
· The calibrator should be familiar with the calibration procedures and the instrument operations according to the user's instruction.
· Confirm and record the model number and the serial number of IUC (including antenna). If accessories package of IUC is incomplete, inform the customer to return the IUC or to prepare accessories package completely.
· Take out the IUC and the antenna from the box in the under-calibration zone. Inspect the instrument appearance and give a general check. Set the parameters: the lowest angle of satellites (cutoff angle), the minimum number of satellites, and the sample rate according to the operation menu.
· Check the forced-centering base on the pillars in calibration field, it should not be loose.
· Make sure the receivers of permanent GNSS stations TNML and TCMS are receiving GNSS data normally.
· Receivers should be open to the sky. The line of sight between receivers and satellites should not be blocked by objects near by the calibration field when the calibration procedures are executing.
CALIBRATION STEPS
· Open the aluminum covers of base point, set up the antenna of GNSS on the forced-centering base on pillars, rotate the direction mark on antenna to the north and fix it. Check the ends of signal cable are plugged in the antenna and IUC receiver exactly.
· Turn on the power of IUC. According to the operation menu to set the parameters: the lowest angle of satellites (cutoff angle) to be 15°, the minimum number of satellites should be 3, measurement time interval (sampling rate) to be 15 seconds, and measurement time to be 8 hours.
· Make sure the battery life to 12 hours and data memory is enough. Start to measure and recheck the GNSS data are recorded in the memory exactly until to 8 hours.
· Download the data from IUC according to the procedures of operation menu. Transform all raw data to RINEX format, and filename is named by the principle of calibration base point and GNSS days.
· Take out antenna from fixed pillar and put it in the box exactly and close it.
· Set up the working standard of antenna and GNSS receiver of this calibration system on the forced-centering base on the pillars, rotate the direction mark on antenna to the north and fix it. Check the ends of signal cable are plugged in the antenna and receiver exactly.
· Turn on the power of GNSS receiver. According to the operation menu to set the parameters: the lowest angle of satellites (cutoff angle) to be 15°, the minimum number of satellites should be 3, measurement time interval (sample rate) to be 15 seconds, and measurement time to be 24 hours.
· Make sure the battery life to 12 hours and the data memory is enough, the start to measure until to 24 hours continuously.
· Stop measuring, download the GNSS data from working standard receiver. Transform the raw data to RINEX format, and filename is named by the principle of calibration base point and GNSS days.
Uncertainty analysis
Following the evaluation method recommended by ISO, all the error sources shall be classified into type A and type B. Type A is evaluated by the statistical method and type B by other methods. Both evaluations are based on hypothetical probability distribution. All the estimated standard uncertainties are then combined to the combined standard uncertainty. The coverage factor and the expanded uncertainty are determined at the 95 % level of confidence. The error sources and the expanded uncertainties of the calibration results are analyzed as follow:
MODELING THE MEASUREMENT EQUATION
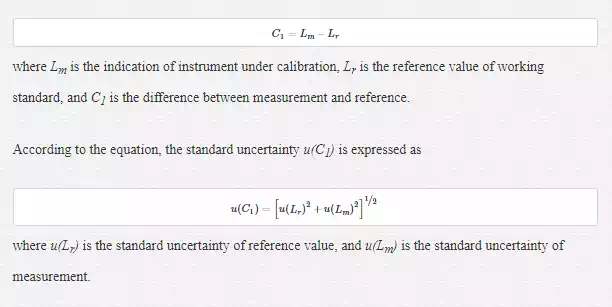
The difference (C1) between the indication of instrument under calibration (Lm) and the reference value of working standard (Lr) is expressed as
UNCERTAINTY IN COORDINATES OF TNML PERMANENT STATION
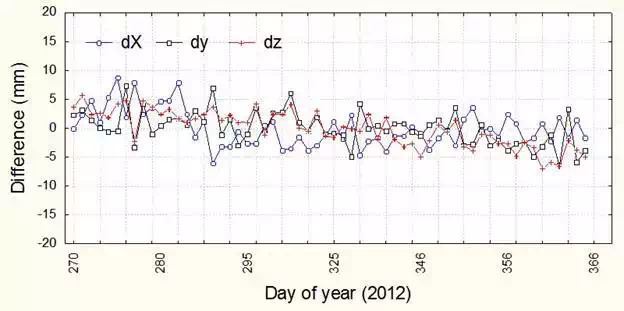
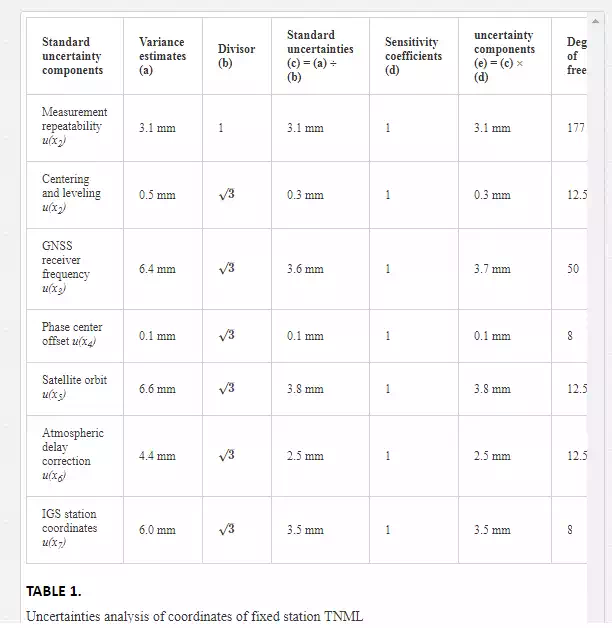
1. Standard uncertainty of measurement repeatability u(x1): Data from four IGS tracking stations (USUD, GUAM, NTUS and WUHN) were obtained 60 days from October 2012 to December 2012. The 3D coordinates of TNML are calculated and shown in Figures 5. The standard deviations of the TNML coordinates are as follows: standard deviation in X axis σX3 = 3.2 mm, standard deviation in Y axis σY3 = 2.9 mm, standard deviation in Z axis σZ3 = 3.1 mm. If the 3D coordinates of TNML are equally weighted, the 1D combined standard uncertainty was σ1 = [(σX32 + σY32 + σZ32) / 3]1/2 = [(3.22 + 2.92 + 3.12) / 3]1/2 = 3.1 mm. The uncertainty of repeatability of measurement of TNML u(x1) = 3.1 mm at the 68.3 % confidence level. Moreover, 60 measurements were made and the degrees of freedom was ν1 = 3 × 60 − 3 = 177.
1. Standard uncertainty of centering and levelling u(x2): We utilized the forced centering device to set up the GNSS antenna and the maximum 1D error was about 0.5 mm [10]. When it comes to the distribution, the rectangular was considered and the 1D standard uncertainty was obtained as u(x2)= 0.5 / 31/2 = 0.3 mm. The relative uncertainty was determined at 20 % and the degrees of freedom was calculated as ν2 = (1/2) × (20/100)−2 = 12.5.
2. Standard uncertainty of GNSS receiver frequency u(x3): The AOA BenchMark receiver is adopted at station TNML and its internal frequency is traced to the NSTFL. The frequency stability, expressed as a modified Allan deviation, nominal specifications is less than 10−12 [11]. The frequency stability of the external rubidium oscillator is 10−13. The 1D error from the frequency stability for GNSS positioning is obtained to be about 2 mm + 0.002 × 10⁻⁶ × D, where D (around 2200 km) is the average distance from TNML to IGS tracking stations. The 1D error is approximately 2 mm + 0.002 × 10−6 × 2.2 × 109 mm = 6.4 mm. When it comes to the distribution, the rectangular was considered and the 1D standard uncertainty was obtained as u(x1) = 6.4 / 31/2= 3.7 mm. The relative uncertainty is determined as 10 % and the degrees of freedom is ν3 = (1/2) × (10/100)−2 = 50.
3. Standard uncertainty of phase center offset and variation u(x4): The 1D error from the offset and variation of the antenna’s phase center is around 0.1 mm after correction [12]. When it comes to the distribution, the rectangular was also considered and the 1D standard uncertainty was obtained as u(x4) = 0.1 / 31/2 = 0.1 mm. The relative uncertainty is determined at 25 % and the degrees of freedom is ν4 = (1/2) × (25/100)-2 = 8.
4. Standard uncertainty of satellite orbit u(x5): The precision of the IGS final orbit is better than 5 cm and these data are downloaded from the IGS website. The 1D error from the satellite orbit for GNSS positioning is around 0.003 × 10⁻⁶ × D, which is almost equal to 5 cm divisor 20,000 km (the distance to satellite), where D (around 2200 km) is the average distance from TNML to IGS tracking stations. The 1D error is about 0.003 × 10−6 × 2.2 × 109 mm = 6.6 mm. When it comes to the distribution, the rectangular was also considered and the 1D standard uncertainty was obtained as u(x5) = 6.6 / 31/2 = 3.8 mm. The relative uncertainty is determined as 20 % and the degrees of freedom is ν5 = (1/2) × (20/100)-2 = 12.5.
5. Standard uncertainty of troposphere and ionosphere delay correction u(x6): In the relative positioning, most of the tropospheric and ionospheric errors are reduced. The error after correction is about 0.002 × 10⁻⁶ × D [13], where D (around 2200 km) is the average distance from TNML to IGS tracking stations. The 1D error is approximately 0.002 × 10−6 × 2.2 × 109 mm = 4.4 mm. When it comes to the distribution, the rectangular was also considered and the 1D standard uncertainty was obtained as u(x6) = 4.4 / 31/2 = 2.5 mm. The relative uncertainty is estimated at 20 %, therefore degree of freedom is ν6 = (1/2) × (20/100)-2 = 12.5.
6. Standard uncertainty of IGS station coordinates u(x7): The 1D coordinate repeatability of IGS tracking stations are 3–6 mm [8] and the maximum errors are used as 6 mm. When it comes to the distribution, the rectangular was also considered and the 1D standard uncertainty was obtained as u(x7) = 6 / 31/2 = 3.5 mm. The relative uncertainty is calculated as 25 % and the number of degrees of freedom is ν7 = (1/2) × (25/100)-2 = 8.
Table 1 presents the uncertainties at station TNML.
UNCERTAINTY IN COORDINATES OF THE ULTRA-SHORT DISTANCE NETWORK
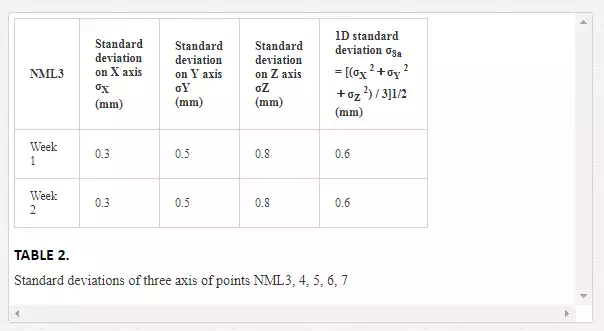
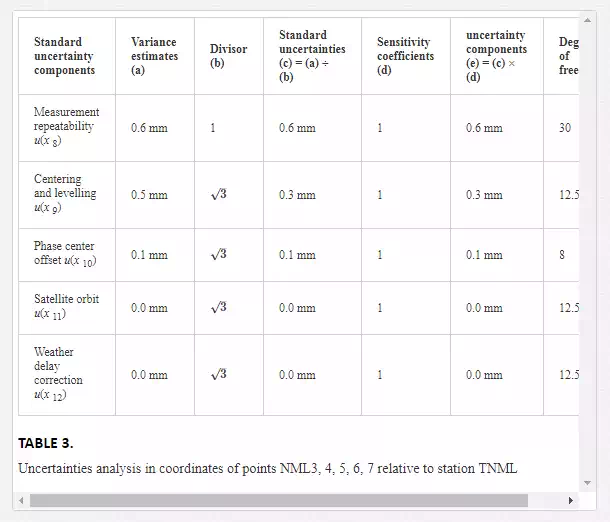
1. Standard uncertainty of reference measurement repeatability u(x8): Coordinates of calibration pillars NML 3 were measured using GNSS working standard for 2 weeks. The data processing utilized the reference station TNML and obtained the ITRF coordinates in two sessions. Moreover, the 1D standard deviation was calculated as shown in Table 2. The average distance from fixed station TNML to each pillar is around 48 m. The number of degrees of freedom is ν8 = 2 × 3 × (6−1) = 30. The 1D combined standard uncertainty is u(x8) = [(0.62 + 0.62) / 2]1/2 = 0.6 mm
1. Standard uncertainty in centering and levelling u(x9): The same descriptions in chapter 4.2, standard uncertainty of instrument’s levelling and centering is u(x9) = 0.5 / 31/2 = 0.3 mm. The relative uncertainty was calculated at 20 % and the number of degrees of freedom was ν9 = (1/2) × (20/100)-2 = 12.5.
2. Standard uncertainty in phase center offset and variation u(x10): The same descriptions in chapter 4.2, a rectangular distribution is assumed and 1D standard uncertainty is u(x10) = 0.1 / 31/2 = 0.1 mm. The relative uncertainty was calculated at 25 %, and the number of degrees of freedom was ν10 = (1/2) × (25/100)-2 = 8.
3. Standard uncertainty in satellite orbit u(x11): The same descriptions in chapter 4.2, the range of the influence is about 0.003 × 10-6 × 48 × 103 ≒ 0.0 mm (1.44×10⁻⁴). A rectangular distribution is assumed and 1D standard uncertainty is u(x11) = 0.0 / 31/2 = 0.0 mm. The relative uncertainty was calculated at 20 %, and the number of degrees of freedom was ν11 = (1/2) × (20/100)-2 = 12.5.
4. Standard uncertainty in troposphere and ionosphere delay correction u(x12): The same descriptions in chapter 4.2, the extent of the 1D influence is about 0.002 × 10−6 × 48 × 103 mm ≒ 0.0 mm (9.6×10⁻⁵). A rectangular distribution is assumed and the 1D standard uncertainty is u(x12) = 0.0 / 31/2 = 0.0 mm. The relative uncertainty is estimated at 20 %, therefore degree of freedom is ν12 = (1/2) × (20/100)-2 = 12.5.
Table 3 presents the uncertainties of coordinates of the ultra-short distance network (NML3, 4, 5, 6, 7 relative to TNML).
COMBINED STANDARD UNCERTAINTY IN COORDINATES OF TNML
The sources of error are assumed to be independence. The 1D combined standard uncertainty of fixed station TNML is uc(C1)

COMBINED STANDARD UNCERTAINTY IN COORDINATES OF THE ULTRA-SHORT DISTANCE NETWORK
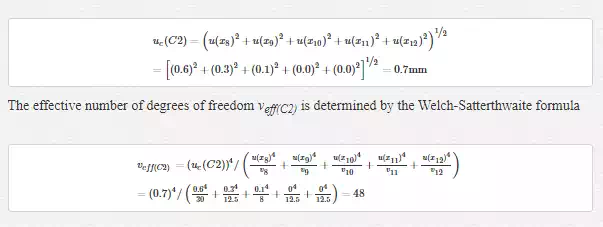
The sources of error are assumed to be independence. The 1D combined standard uncertainty in coordinates of base points NML3, 4, 5, 6, 7 relative to TNML is uc(C2)
EXPANDED UNCERTAINTY IN COORDINATES OF TNML
At the 95 % confidence level, the coverage factor k1 is 1.99 when the effective degrees of freedom νeff(C1) is 73. The 1D expanded uncertainty U1 is equal to the coverage factor k1 multiplied by the 1D combined standard uncertainty U1 = k1 × uc(C1). Furthermore, the 1D expanded uncertainty of reference station TNML is U1 = 1.99 × 7.5 = 14.9 mm at the 95 % confidence level. At the 95 % confidence level, the 3D coverage factor k1_3D is equal to 2.79 (issued by Federal Geodetic Control Committee in America [15]). Therefore, at the 95 % confidence level, the 3D expanded uncertainty of the reference station TNML is U1_3D = k1_3D × uc(C1) = 2.79 × 7.5 = 20.9 mm.
EXPANDED UNCERTAINTY IN COORDINATES OF THE ULTRA-SHORT DISTANCE NETWORK
At the 95 % confidence level, the coverage factor k2 is 2.03 when the effective degrees of freedom νeff(C2) is 33. The 1D expanded uncertainty U2 is equal to the coverage factor k2 multiplied by the 1D combined standard uncertainty U2 = k2 × uc(C2). Furthermore, the 1D expanded uncertainty of points NML3, 4, 5, 6, 7, relative to the reference station TNML is U2 = 2.03 × 1.7 = 3.5 mm at the 95 % confidence level. The 3D coverage factor k2_3D is equal to 2.79 [15] at the 95 % confidence level. Therefore, the 3D expanded uncertainty of points NML3, 4, 5, 6, 7, relative to the reference station TNML is U2_3D = k2_3D × uc(C2) = 2.79 × 1.7 = 4.8 mm at the 95 % confidence level.
Measurement assurance program
The analysis of uncertainty in measurement of GNSS static and kinematic positioning calibration system is according to the “Guide to the Expression of Uncertainty in Measurement” published by ISO and has been discusssed in chapter 4. The measurement assurance program designed a process using a set of checking parameters and measurement control charts. The approach of measurement assurance program was recommended by SP676-II [16] published by National Institute of Standards and Technology (NIST) in U.S.A.
QUALITY ASSURANCE DESIGN
There are two units to check: (1) checking the accuracy of the coordinates of fixed station TNML, and (2) the accuracy of the slope distances of the ultra-short distance network.
· Analysis of the coordinates of fixed station TNML
Data from four IGS tracking stations (USUD, GUAM, NTUS and WUHN) were obtained every day for whole year. The 3D coordinates of TNML are calculated for daily solutions over one year. The mean and the standard deviation values are obtained. The standard deviation is as the control parameter and to monitor the accuracy of the measurement system.
· Analysis of the slope distances of the ultra-short distance network
The slope distances of calibration pillars NML 3, 4, 5, 6 and 7 were measured using GNSS receivers. Besides, processing the data associated with station TNML using Bernese software yielded relative distances and the standard deviation was computed.
PARAMETERS AND CONTROL CHART
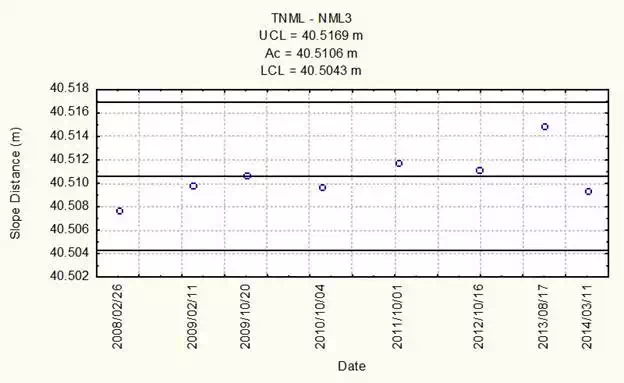
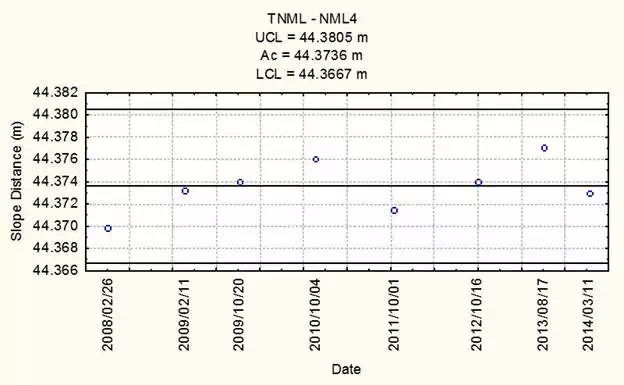
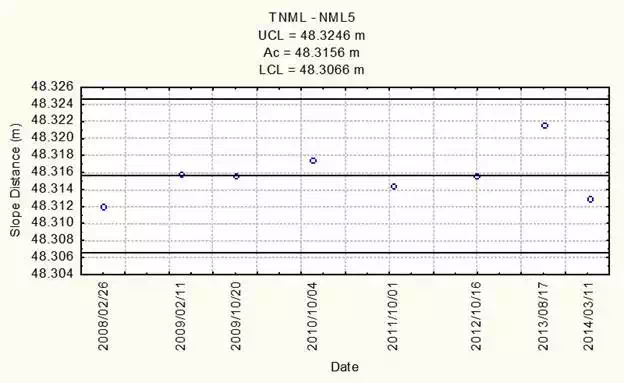
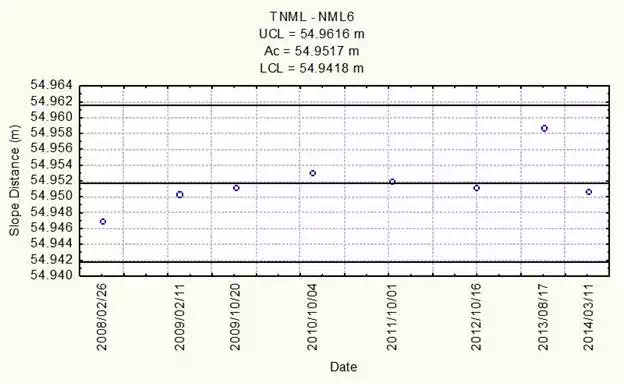
Measurements were taken periodically using the procedure mentioned previous section. The checking parameters include the arithmetic mean (Ac), upper control limit (UCL), and lower control limit (LCL). The coverage factor is 3.0 at the 99.7% confidence level. Every control chart should renew at least every year.
· The control chart of the coordinates of fixed station TNML
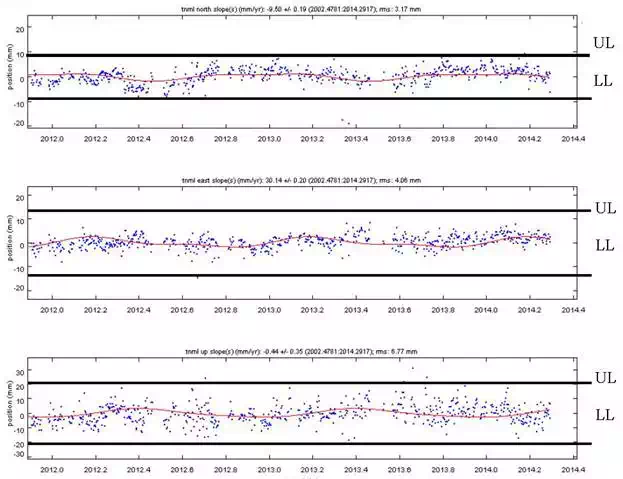
Measurements were obtained 24 hours for every day from January in 2012 to April in 2014. The 3D coordinates of TNML daily solutions are calculated and the control charts are shown in Figure 6. The ITRF2005 coordinates of the TNML are as follows: Xavg = -2982779.3482 m, Yavg = 4966662.5319 m, Zavg = 2658805.6435 m. The transformed geographical coordinates are: Latavg = 24.79795393 deg, Longavg = 120.98734731 deg, and Havg = 75.8685 m. The upper control limit for Latitude is UCLLat = 9.5 mm and lower control limit LCLLat = -9.5 mm. The upper control limit for Longitude is UCLLong = 12.2 mm and LCLLong = -12.2 mm. The upper control limit for Height is UCLH = 20.3 mm and LCLH= -20.3 mm.
· The control chart of the slope distances of the ultra-short distance network
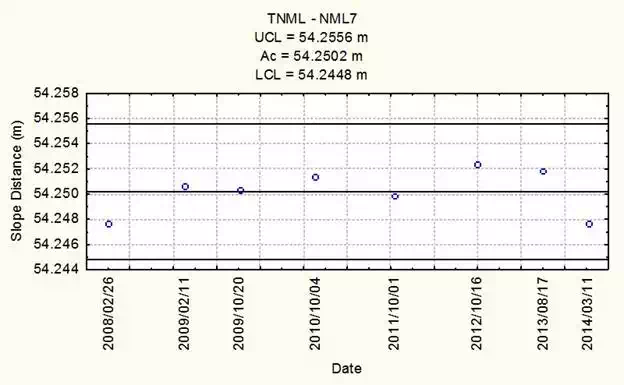
Measurements were obtained from February 2008 to March 2014. The slope distance from calibration pillars to TNML are calculated and the control charts are shown in Figures 7 to 11. The upper control limit (UCL) and lower control limit (LCL) are determined at the 99.7 % confidence level.
Conclusion
This chapter describes the procedures of the calibration for the GNSS receivers by using the GNSS ultra-short baselines calibration network and the precise GNSS positioning units. The main purposes are describing the error sources caused by the calibration procedure of the GNSS receivers and analyzing the uncertainties of the calibration system. The evaluated uncertainties include measurement repeatability, centering and levelling, phase center offset, satellite orbit and the correction for atmospheric delay. The other errors such as human and material resources did not discussed here. The uncertainties evaluations of the calibration system are according to the “Guide to the Expression of Uncertainty in Measurement” published by the ISO.
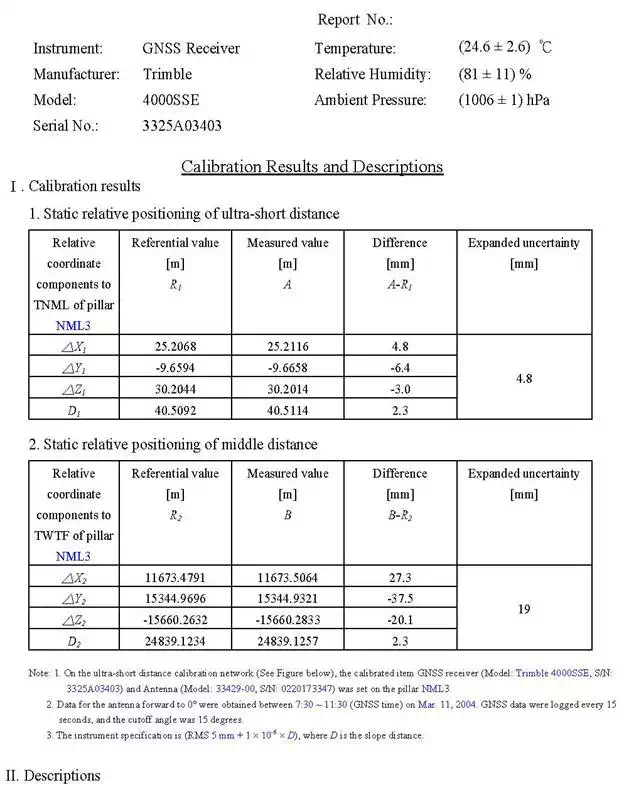
The ISO method is adopted to calculate the expanded uncertainty of the calibrating network for GNSS calibration system. At the 95% confidence level, the 3D expanded uncertainty of the reference station TNML is around 20.9 mm. The 3D expanded uncertainties of the ultra-short distance network are obtained to be approximately 4.8 mm in relative to the reference station TNML. The example of the calibration report please refers the appendix. We believe the precision of the calibration system is enough to evaluate the performance of the geodetic GNSS receivers and to ensure the precision of the regional users. This method can check the quality of GNSS receivers in time. Following the standard operating procedure, the accuracy of the GNSS positioning can be ensured for accommodating the ISO requirement.
Appendix
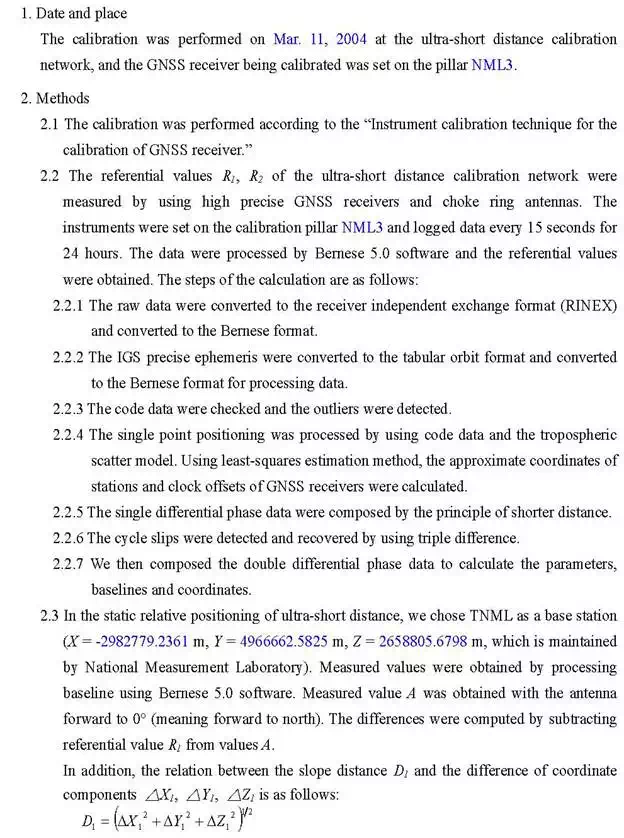
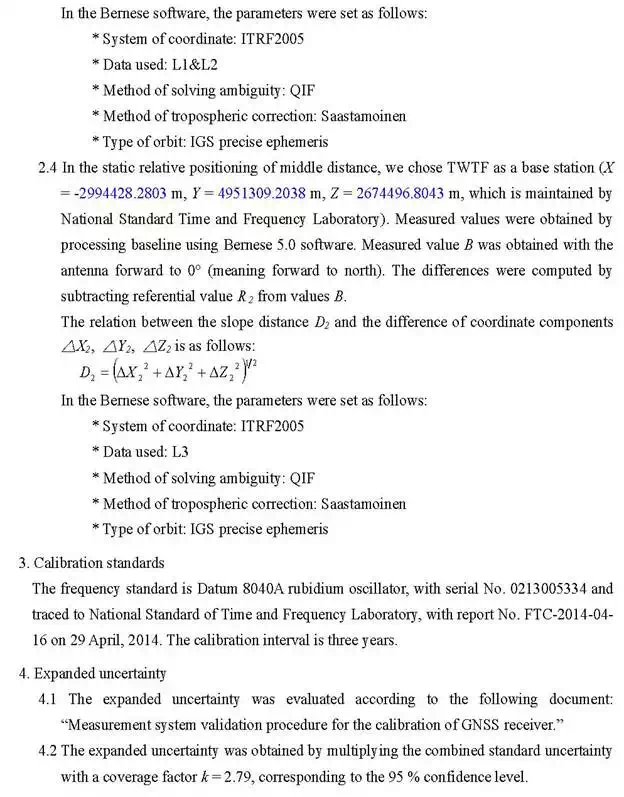
Example of a calibration report [1]
Acknowledgements
The author would like to thank Dr. Chiung-Wu Lee (National Measurement Laboratory of Taiwan) for providing valuable informations, which deeply help me to finish this chapter. The author also would like to thank the Ministry of Science and technology of the Republic of China, Taiwan, for financially supporting this research under Contract No. MOST 102-2622-E-305-002-CC3.
