L1 GPS as Tool for Monitoring the Dynamic Behavior of Large Bridges
Ana Paula Camargo Larocca1, Ricardo Ernesto Schaal2 and Marcelo Carvalho dos Santos3
[1] Department of Transportation Engineering, Polytechnic School, University of Sao Paulo, Brazil
[2] Departament of Transportation, Sao Carlos Engineering School, University of Sao Paulo, Brazil
[3] Department of Geodesy and Geomatics Engineering, University of New Brunswick, Canada
Introduction
In 1973 the JPO (Joint Program Office) subjected to United States Air Force received the mission of Department of Defense for implanting, developing, testing and use a spatial positioning system for military applications and able to calculated coordinates and guide missiles according to the project “Star Wars”.
The Global Positioning System is fruit of those studies which became able to use the L band of carrier phase (frequency microwaves around 1 up to 3 Ghz and wave length close to 23 cm) for calculating the spatial trilateration. Therefore, in 1978 began the launch of the first NAVSTAR (Navigation Satellite with Time and Ranging) satellites – the begging of GPS as is known today. Due to the high cost of project and as the MIT confirmed by itself the excellence on civil applications (geodesy, topography, navigation, digital modeling, simulators), the American Congress, with the acquiescence of the U.S. President, pressed the Pentagon to open the NAVSTAR system for civil use and other countries. However, only from the 90s is that the GPS became popular. This was a result of technological advance in the micro-computers field allowing the trackers manufacturers to produce the GPS receivers that processed in the receiver, the codes of the received signals.
In this context, from the end of the 80´s, the technology of Global Positioning System, until then, used to conduct surveys of areas, deploy geodetic networks, manage resources, track fleets of vehicles, ships, achieve the control of displacements of structures under static load, etc. began to be used to characterize the dynamic displacement of large structures, earthquakes and so, it was being considered as a tool to extract the values of frequency and amplitude of the displacements with a good accuracy. The amplitude range of displacements detectable with GPS allows to be used as a tool for monitoring the displacement in several kind of structures and the development of sensors of 100 Hz date rate, it will be possible to identify not only the natural frequencies of a structure, but also the frequencies of its several vibration modes.
Goad (1989) conducted the first experiments with the purpose of investigating the feasibility of using GPS to monitor the crest of a dam in Lawrence, Kansas, USA and Lovse et al. (1995) performed the first test to measure the frequency vibration of Calgary Tower in Alberta, Canada, using GPS receivers in differential mode and conventional instruments. The authors verify that the frequency of vibration of the tower of 160 m high, under the wind action was approximately 0.3 Hz.
This time until the present day, several methods were developed and tested the detection of small amplitudes and frequencies of dynamic displacements, but with no results so promising as this that only uses the signal from two satellites through the interferometry technique.
Theoretical basis of methods developed
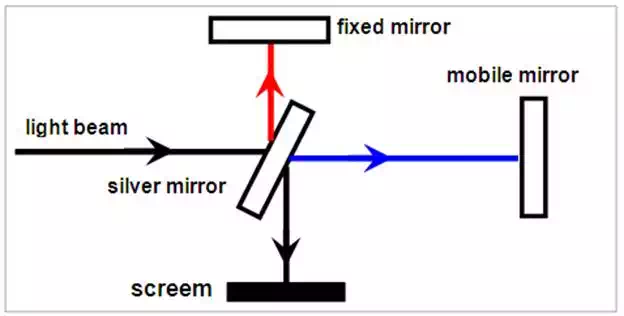
The method applied on this research uses the GPS data supported on the interferometer phase principle. The interferometry is use of the phenomenon of interference between signals, to perform, for example, measures of distance through the phase change caused on one of the both signals. Figure 1 shows, a light beam incident on a mirror is divided into two beams perpendicular to each other. Part of the light beam is reflected and part through another medium. This portion hits a silver mirror and is reflected. Furthermore, the other portion hits another mirror, which can be moved and is also reflected. In this case the beams walk the same distance and the reconstituted light source can be seen reflected on the screen (Holmes, 1998).
If the mobile mirror is moved a distance from its original position, the beam of blue light travel a distance greater than the red beam, causing a different pattern of interference, which can be seen on the screen (Figure 2).
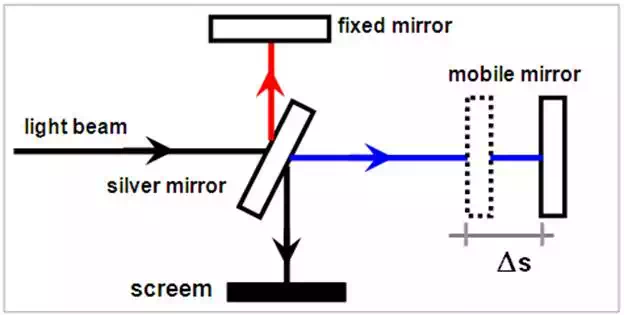
Considering the beam of light as the electromagnetic wave emitted by the antenna of a GPS satellite and the mirrors with the GPS antenna (Figure 2), vertical or horizontal movements senoidais suffered by the mobile antenna will change the phase of the signal collected by the receiver connected to this antenna. This changes the relationship between phases of the GPS signal received by antenna - mobile and static - since the length of the path is no longer the same. This phase change, then caused by the movements caused by the antenna may have its amplitude and frequency calculated. The mobile antenna, for example, can be fixed in a structure under dynamic loading action.

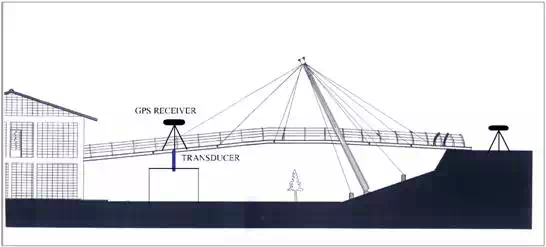
Illustrated in Figure 4 is a GPS antenna set in middle of a suspension bridge under dynamic oscillation. The frequency and amplitude of oscillation of the middle can be determined from the analysis of GPS signals collected.

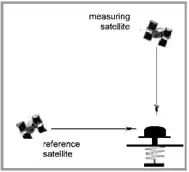
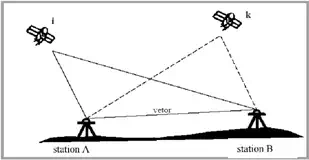
The method, based on the interferometer phase, requires only the data collection from two satellites, with phase angle of around 90 degrees and not more than a constellation of more than four satellites. Thus, to measure a vertical displacement, for example, is necessary that one satellite be close to 90 degrees and another with elevation next to the horizon (Figure 5). Processing of double difference phase the lowest satellite is considered as the reference satellite, allowing then to obtain the vector of residues of the highest satellite, called here the 'measuring satellite'. With this configuration, there will be a great contribution in the final result of processing the data of double phase difference - residuals – (item 2.1) due to changes in phase, the signal of the satellite close the zenith in relation of the satellite close the horizon, which hardly detects the movement of the antenna.
Similarly, when it is desired to characterize horizontal displacements, the highest satellite is considered as a reference, allowing to obtain the residuals vector of the lowest satellite, will be found where the largest contribution of 'errors' due to changes in signal phase of the satellite close the horizon.
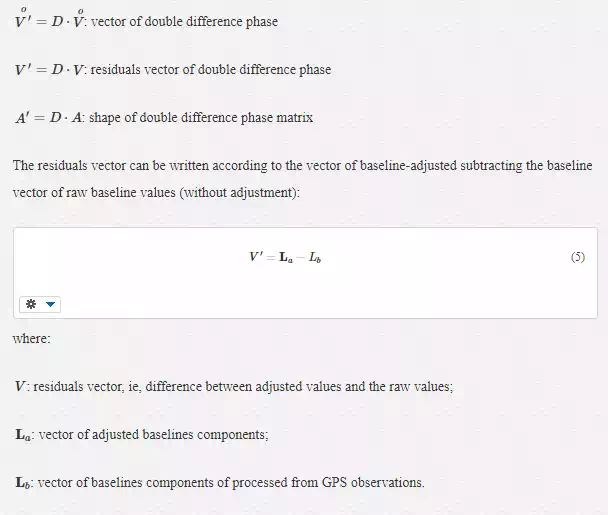
DOUBLE DIFFERENCE PHASE
The double difference phase, illustrated in Figure 6 is represented by the equation:
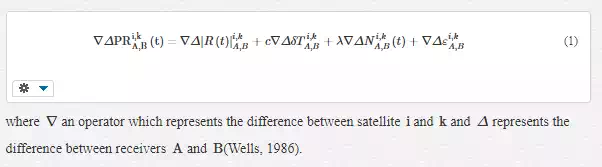
When the baseline done (distance between two points observed with GPS receivers) is short (less than 10 km distance), the errors due to the satellites orbit and errors due to tropospheric and delay ionosferic delay can be removed or reduced almost totally due to similarity of the conditions observed in two points. Furthermore, errors due to multipath, errors due to variation of antenna phase center and (Tranquila, 1986), loss of cycle and other random errors are not removed. And it is possible to access the corresponding value to these errors by the remaining residues of the double phase difference obtained from the adjustment of observations by least squares. This method consists on accepted as the best estimate of the redundant observations the value that become minimum the sum of the squares of the residuals. Rewriting the eq. [01] in matrix shape it has been:

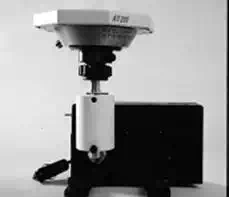
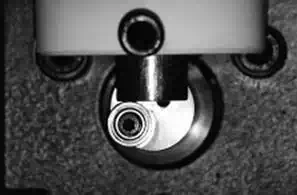
ELECTRO-MECHANIC OSCILLATOR FOR CALIBRATING VIBRATIONS
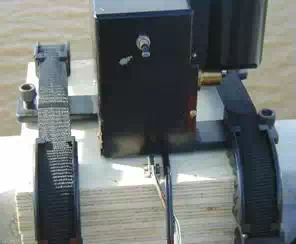
To calibrate the measurement of dynamic displacements previously unknown was developed an electro-mechanical oscillator which applies controlled movements - on related to displacement and the speed of it - on the GPS antenna that will suffer the movements of the footbridge span and the bridge. The oscillator is powered by battery. Figures 7 and 8 present a GPS antenna mounted on the oscillator and a detail of the system that controls the amplitude of the displacement.
SPECTRAL ANALYSIS OF GPS DATA
The Fast Fourier Transform was the tool chosen to perform the analysis of the double difference phase residuals, here called raw residuals, in the frequencies domain and consequently, to identify the corresponding frequencies due to periodic displacements in a spectrum that also presents the very low frequencies due to multipath of the environments highly noisily and others - effects of variation of the antennas phase center - which is accentuated in highly reflective environments and in a not static observations (Wells et al., 1986).
The essence of the Fourier Transform (FT) of a wave is to decompose or separate it into a sum of different frequencies senoides. If the sum of these senoides results in the form of original wave, then was given its Fourier Transform. A function of wavelength, in the time domain is transformed to the domain of frequencies, where is possible to determine the magnitude, frequency of the wave and perform the filtering of undesired frequencies (noise), Brighan (1974).
Tested structures for the method analysis
The dynamic analysis of a structure aimed to determine the maximum displacements allowed by the project (design constraints), speed and accelerations (comfort for users), internal efforts, stress and deformations (fatigue of the material that composes the structure) (Laier, 2000). Thus, the analysis can diagnose the actual state of structure conservation (regardless of external appearance), predict its life time and determine economic solutions of recovering in order to prolong the durability of the structure.
Two bridges were submitted to dynamic tests – mobile load - to test the GPS as tool for monitoring structures.
The first structure tested was a cable-stayed wood footbridge built in Sao Carlos Engineering, University of São Paulo, São Paulo state, Brazil, in 2002 (Figure 9), Pletz (2003). The footbridge, which is presented as the first wood footbridge built in Brazil with the deck in curve shape, has a 35 meters total length deck on Pinus taeda wood and wood used for the tower was Eucalyptus citriodora. The tower consists of a pole with thirteen meters long, 55 cm in diameter at the base and 45 cm at the top. The footbridge was divided into seven modules with nominal dimensions of 5 m in length, 2 m wide, 20 cm in height, each consisting of 37 slides measuring 5 cm in width and 20 cm high and 5 m in length (Pletz, 2003).
Cable- Stayed wood footbridge in Sao Carlos Engineering School, USP
The second structure where the method was tested is the Hawkshaw Bridge (Figure 10), a cable-stayed bridge with cables anchored in a harp shape. The bridge is located in the province of New Brunswick, Canada, at Hawkshaw Bridge Road, 0.20 km North, at the intersection with Highway 2, in the Nackwic district and it link the two shores of the Saint John River.
The Hawkshaw Bridge is composed by a steel deck i-beam, with three spans. Inaugurated in 1967, the bridge has its longitudinal axis predominantly in the north-south direction. The center span has 217 m in length, the north direction span has 29.44 m and the south has 54.44 m, a total of 301.20 m. The deck is supported by two steel towers with 36 m in height where six sets of steel cables are fixed on each side. The board has width of 7.90 m, with two traffic lanes in opposite directions (Figure 10)

The footbridge and the bridge have in common the constructive system, based on the theory of cable-stayed. A description of the structural function of this type of structure is described below.
STRUCTURAL BEHAVIOR OF TESTED STRUCTURES
The cable-stayed bridge can be defined as a structure composed by a main beam supported by steel cables tensioned, stuck on top of one or more towers, having then two or more spans. A good comparison for understanding the structural system of a cable-stayed bridges is to imagine that the arms of the human body is the board of the bridge and the head becomes the tower, creating two identical spans in length (the arms) and the muscles support the arms (Figure 11). With a piece of rope, of 1m length, tie the two elbows and puts the middle of the rope on the head. Thus, the string will act as a cable stayed that supports the elbow. With a second piece of rope, of 1.5 m long cable is then the two pulses. There was the same way, placing the rope on the head, there is another cable stayed. The strength or compression of the two cables that support the arms (board) is felt in the human body on the head, then, the bridge tower. Thus, as the cables can be used as intermediate supports for beams, the concept of bridge estaiada can overcome long spans. The cables are then the most important elements of a bridge estaiada because they, under stress, support the weight of the beams and transfer efforts to the mooring system, the fixed towers, suffering compression (Tang et al. (1999); http://www.pbs.org/wgbh/nova/bridge/meetcable.html).
Fonte: http://www.pbs.org/wgbh/nova/bridge/meetcable.html
FIGURE
Concept of cable-stayed bridge
Tests on a cable-stayed wood footbridge
According to the objective of to monitor the dynamic behavior of the footbridge were planned forced vibration tests to be made with pedestrians walking over the deck. Each test lasted approximately 10 minutes, enough time to excite the several vibration modes of the footbridge.
INSTRUMENTATION
The instrumentation consisted of a pair of GPS receivers with 20 Hz data rate with choke ring antennas and a transducer of displacement Kiowa DT 100, with Vishay data acquisition system of 20 channels and 10 Hz data rate, model 5100B Scanner. Figure 12 illustrates the layout of the instruments used on a footbridge and Figures 13 and 14 illustrate the layout of these instruments in the footbridge. The electro-mechanical oscillator was adjusted to apply a displacement with amplitude of 12 mm and frequency of 1.0 Hz.
![]()
FIGURE
Transducer of displacements and data acquisition system
Preliminary tests with pedestrians walking on the bridge were made for a rough knowledge of the dynamic behavior of the bridge, monitoring the extent and frequency of vertical displacement, which was conducted by two observers. One observer, using a total station and a piece of tape measure set in the center of the leg 2 determined the average amplitude of the approximate vertical displacement caused by pedestrians. Another observer determined with the aid of a stopwatch, the approximate frequency of the footbridge at the same time. And the values obtained for the scale ranged between 8 and 12 mm and frequency varied in the range from 100 to 120 cycles per second, this value of frequency of vibration induced by pedestrians, as set out by Pretlove et al. (in CEB, 1991).
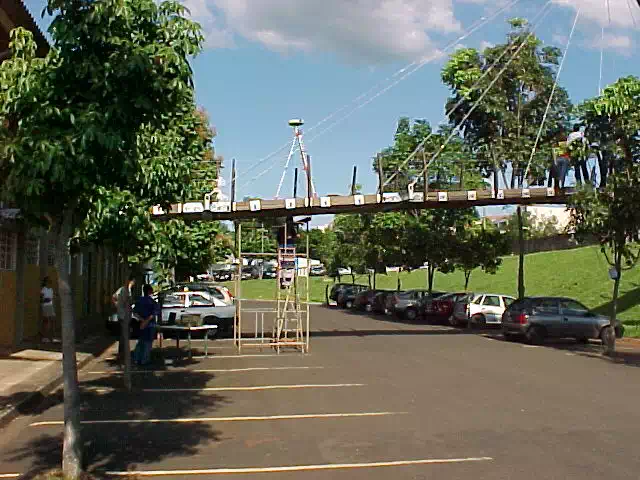
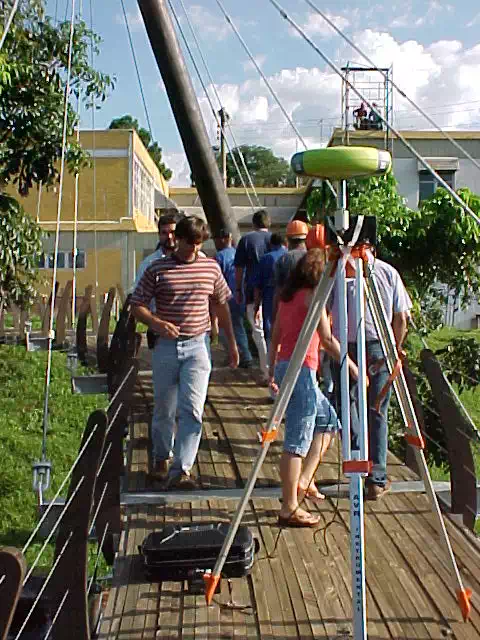
During the tests, the antenna was set in electro-mechanical oscillator to have a peak in the spectrum of known frequency and amplitude, and then serve as a calibrator for the peak due to the displacement of the bridge. Thus, the oscillator was adjusted to apply movement amplitude of 3 mm, with a frequency of 1 Hz at the antenna. The forced vibration tests were performed using a mobile people and cargo, which walked in an orderly way on the board (Figures 15 and 16).

FOOTBRIDGE TESTS RESULTS
The data processing collected with GPS and transducer displacement are described below.
Figure 17 presents the data obtained with the transducer displacement during the filed test carried out in a footbridge with pedestrians on moving - figures above -. By means of maximum and minimum values recorded it was determined the amplitude of displacement, resulting in 13 mm.
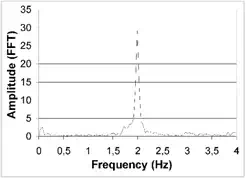
Applying the Fast Fourier Transform (FFT) to these values in the spectrum, it can clearly see the peak corresponding to the periodic movements recorded by the displacement transducer, with frequency of 2.0 Hz (Figure 18).

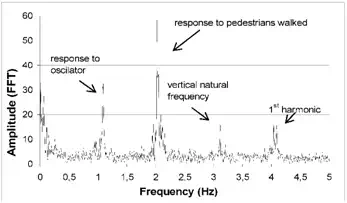
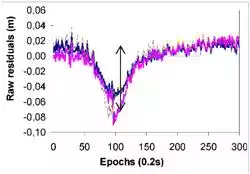
During the tests carried out, the measuring satellite and the reference were close to the 74 degrees (PRN 28) and 05 degrees PRN (26), respectively. Figure 19 illustrates the residuals of double phase difference between these satellites. The spectral analysis of these residues (Figure 20) allows extracting the frequency value of the electro-mechanical device, 1.1 Hz and value of the footbridge, 2.1 Hz, under forced vibration. In Figure 20 it can be observed also that the corresponding peak to the displacement applied by the oscillator at the antenna is perfect because the movements are applied by a machine - the electro-mechanical device. Already, the peak corresponding to the displacement caused by the pedestrian’s action of walking, although ordered, is not perfect, because each person has a step length and a certain weight.
![]()
FIGURE
Raw phase residuals of the dynamic vertical displacement response
FIGURE
Power spectrum of the raw residuals with peaks due to vertical dynamic displacements applied on the GPS antenna
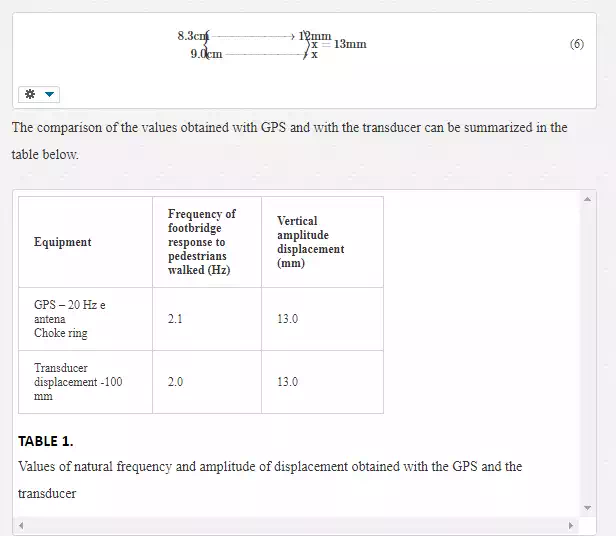
Through the direct comparison of the peaks of amplitudes illustrated in Figure 20, it was determined the value of the displacement amplitude value of the footbridge, because it is known that the corresponding value to the amplitude displacement applied by the oscillator was 12 mm. Measuring up in Figure 20, it was obtained:
Two other tests were performed with 12 minutes duration, with the objective of trying to detect the natural frequency of the footbridge and the harmonic frequencies of other vibration modes.
During these two tests, the reference satellite, PRN 29, was at 16 degrees of elevation and measuring satellite, PRN 28, was at 78 degrees and the footbridge was not instrumented with displacement transducer. The spectral analysis showed the occurrence of more two peaks, besides the peak due to oscillations caused by the electro-mechanical device in the antenna, with a frequency value of 1.1 Hz and the peak due to the action of walking with a frequency of 2.0 Hz, illustrated in Figure 20. In Figures 21 and 22, below, illustrates besides these two peaks, the peak of frequency value equal to 3.1 Hz, corresponding to the value of the natural vertical frequency according to Pletz (2003), which presents to the same frequency, the value of 3.2 Hz obtained by the Finite Elements analysis and the fourth peak, with a frequency value equal to 4.1 Hz, corresponds to the frequency of the first vibration mode.
Tests on a Hawkshaw cable-stayed bridge, Canada
With the objective to monitor the dynamic behavior of a Hawkshaw bridge it was planned forced vibration tests carried out with trucks – design trucks - on the deck during the author's doctoral internship at the University of New Brunswick, Canada in October 2003. The trial was supported by the Department of Geodesy and Geomatics Engineering of University of New Brunswick, Geodetic Research Laboratory, Canadian Center for Geodetic Engineering and the New Brunswick Department of Transportation (NBDT).
INSTRUMENTATION
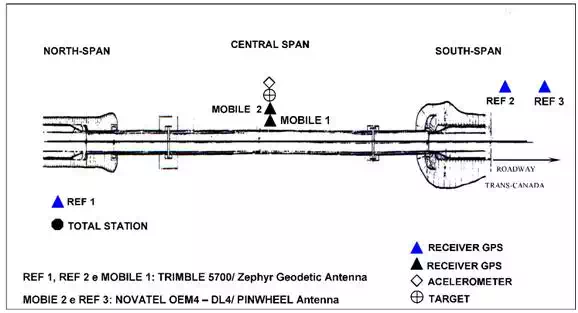
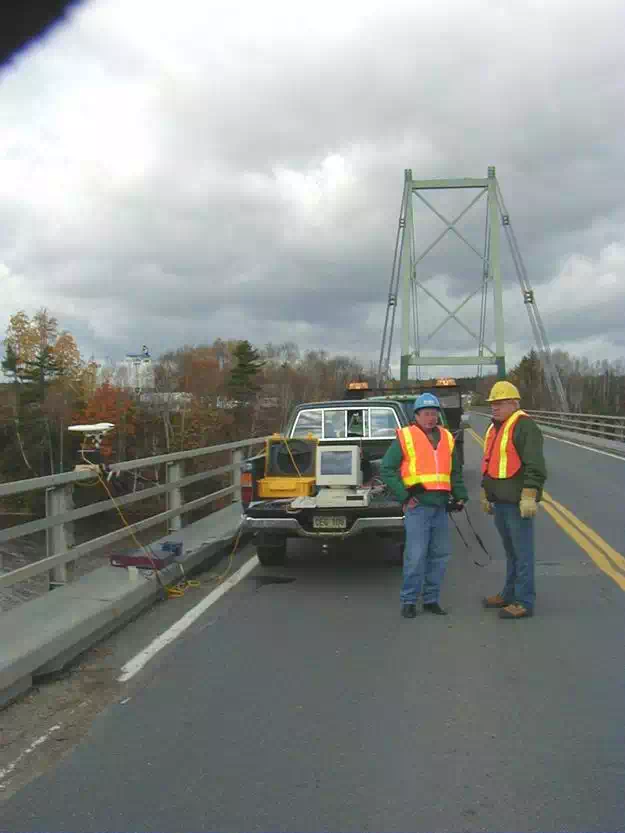
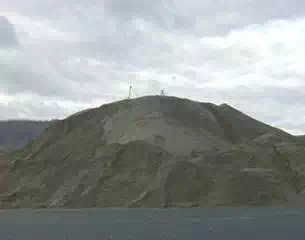
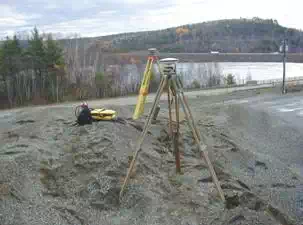
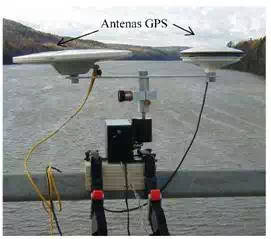
The Figures 23 and 24 below illustrate the layout of equipments installed. Two GPS receivers that were the reference stations were installed on top of a gravel mountain, 30 m from the end of the bridge going to south span, which is the highest place close to the bridge (Figures 25 and 26). For each fixed station, REF 2 and REF 3, it was used a Novatel OEM4-DL4 receiver with Pinwheel antenna and a Trimble 5700 receiver with Geodetic antenna ZephyrTM. In the bodyguard of the central span were installed two GPS receivers on the electro-mechanical device to register well known oscillations besides of the bridge (Figures 27 and 28). All receivers were programmed to collect data with a 5Hz rate. A total station was used to perform measurements with the design-trucks on a deck and also an accelerometer for measurement of the frequencies vibration of the bridge´s deck.
FIGURE
General view of a restricted railway for installing equipments on a central span. On left, Ronald H. Joyce (Senior Technical Advisor – Maintenance and Traffic) and on right Neil Hill (Bridge Superintendent)
Figures 29 and 30 illustrate some examples of-trains that were used as mobile load during the dynamic test on the bridge deck


RESULTS OF TESTS IN A HAWKSHAW BRIDGE
MONITORING OF VERTICAL DISPLACEMENT OF THE DECK
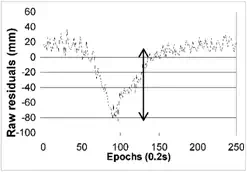
During one of several tests performed on the bridge, the measuring and the reference satellites were close to 81 degrees of elevation (PRN 02) and 09 degrees (PRN 31), respectively. Figure 31 illustrates the residuals of double difference phase of all satellites in relation to PRN 31, since it was looking for at that time, to check the vertical dynamic behavior of the central span when it allowed that four design-trucks crossed the bridge. The crossed takes nearly 75 seconds. In Figure 32 it is possible to see clearly the graphic description of vertical displacement of the instrumented middle span section that reached 8 cm amplitude. Therefore, other four design-trucks were asked to stop in the middle of the central span to take the measures with the Total Station, obtaining a mean value 8.3 cm.
MONITORING OF LATERAL DISPLACEMENT OF THE DECK
During a second test, the reference and measuring satellites were close to the 80 degrees of elevation (PRN 02) and 06 degrees of elevation (PRN 31), respectively. Figure 33 illustrates the residuals of double difference phase for all satellites in relation to the PRN 02, as it was looking for by a lateral dynamic behavior of a central span. And in Figure 33 is possible to see clearly the graphic description of the lateral displacement of the instrumented section in the central span, where a design-truck of 60 tons crossed the bridge. The crossed takes nearly 45 s.
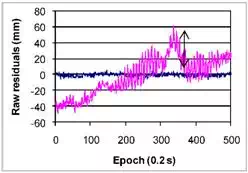
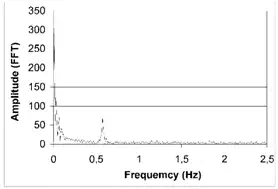
Figure 34 illustrates only the residuals of the lowest satellite (PRN 31) for better visualization of the lateral dynamic displacement caused by a mobile load of 60 tons. The spectral analysis of these residuals (Figure 35) allows extracting value of the deck´s lateral frequency vibration when subjected to vibration caused by a mobile load. The lateral frequency value of the deck was 0.60 Hz. The amplitude of dynamic displacement showed the average value of 3.5 cm. Furthermore, the lateral displacement of the board, when the truck starts to cross, reaches the middle of the deck and starts to exit the bridge, has average amplitude of 3.5 cm.
FIGURE
Raw residuals of lateral dynamic displacements of deck
FIGURE
Raw residuals describing the lateral dynamic displacements of deck
Spectral analysis of these residuals by FFT allows extracting the lateral frequency vibration value when subjected to vibration caused by a design-truck of 60 tons crossing the deck. The lateral frequency of the deck was 0.60 Hz (Figure 35).
TEAM WHICH COLLABORATED FOR PERFORMING THE TESTS
Figures presented below are the people who helped to perform the test. The traffic controllers from NBTD in Figure 36 and in Figure 37 can be seen by the technicians who collaborated for performing the tests - Howard Biggar (Geomatics Technologist – GGE – UNB), E. Daniel Wheaton (Chief Technician Civil Engineering – UNB) e Jason D. Bond (PhD Candidate – CCGE – UNB).
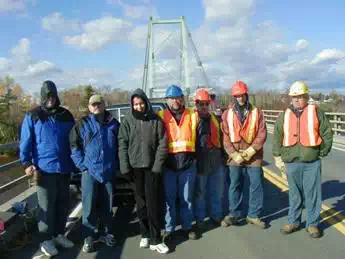
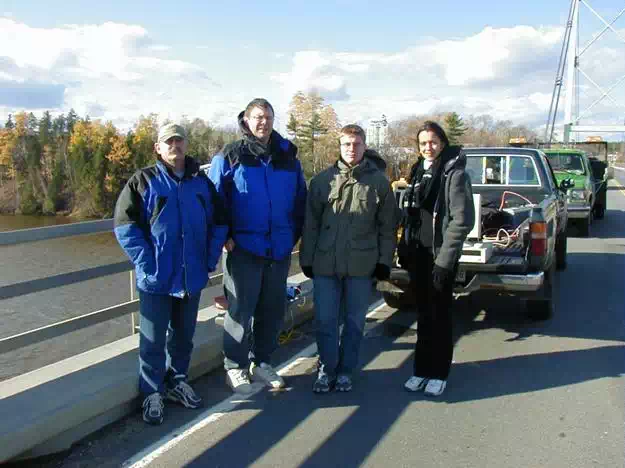
FIGURE
From left to right: Daniel, Howard, Jason and Ana Paula (author)
Conclusions
Based on studies, field experiments and analysis of results presented in this research, it can be concluded that the GPS data collection researched method has been established because its capability and efficiency. And therefore it ensured to GPS the label of monitoring instruments and characterization of the dynamic behavior of structures.
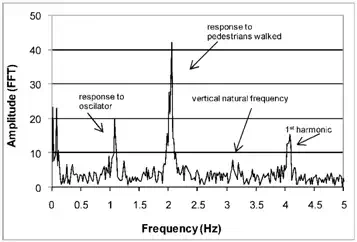
A comparison of results obtained with the GPS and the transducer displacement, resulting from vibration tests conducted on a wood cable-stayed footbridge to confirm the reliability of the results obtained by GPS to characterize the dynamic behavior of structures, which agreed satisfactorily with the values by the Finite Elements theory and theoretical values of CEB (Comite Euro-International du Beton - Bulletin D´ Information no. 209). Therefore, the results proved the efficiency and capability of the collection method and GPS data analysis to obtain the frequency values and amplitude of dynamic displacement, showing that the limitation imposed by the necessity of a particular satellite geometric configuration, in this case did not prejudiced the program and performing the tests. As the method does not required a good geometric distribution of satellites - and only two satellites -, allows obtaining reliable results on the dynamic behavior of a structure in any latitude of the globe. The use of electro-mechanical oscillator as a calibrator was reliable, providing also to produce calibrated values of frequencies and amplitudes of unknown displacements, since the electro-mechanical oscillator can be used to produce known oscillations.
The results of the second test of on using the method of this research on a large man-made road structure, the Hawkshaw Cable-stayed Bridge showed the full possibility on using GPS for characterizing the dynamic behavior of this type of structure.
Given the above, it was concluded that GPS, or the method of data collection employed, allows for the graphical description of the dynamic displacement amplitude of the middle span deck and the identification of modal frequencies of bridges under the controlled traffic action or not, may be used by engineering as a tool for monitoring structures.
Authors express their gratitude to: to Dr. Richard B. Langley (coordinator of Geodetic Research Laboratory Dept. of Geodesy and Geomatics Engineering), University of New Brunswick, Canada for provide several inputs and ideas for trials on bridge; to Canadian Center for Geodetic Engineering (CCGE) for loaning NOVATEL receivers; to New Brunswick Department of Transportation (NBDT) for helping and permission for carried out trials on bridge; to Ronald H. Joyce (Senior Technical Advisor from NBDT); Neil Hill (Bridge Superintendent of Hawkshaw Bridge from NBDT); Howard Biggar (Geomatics Technologist of UNB); E. Daniel Wheaton (Chief technician civil engineering of UNB) and Jason Donald Bond (PhD Candidate at Department of Geodesy and Geomatics Engineering of UNB) and also to Université Laval’s Centre for Research in Geomatics for kindly supplying the GPS data collected from sessions conducted at the Pierre-Laporte Bridge and coordinate values obtained by the Modified GPS-OTF Algorithm, to Dr. Boussaad Akrour for providing additional material and information about the bridge.