Receiver Biases in Global Positioning Satellite Ranging
Pierre-Richard Cornely1
[1] Physics and Engineering Department, Eastern Nazarene College, Massachusetts, USA
Introduction
The ionosphere is a dispersive medium, and taking advantage of this property enables the ionosphere’s total electron content (TEC) to be estimated from the differential delay between the two GPS frequencies (L1 = 1575.42 and L2 = 1227.6 MHz). Other effects in the system, referred to as biases, introduce delays between the two frequencies that must be removed to resolve the TEC accurately. These biases are introduced either by the satellite or by the receiver. This chapter presents the results of an investigation into GPS receiver bias dependence on temperature. Receiver and satellite biases, can be significant, and if not treated correctly, can corrupt the GPS total electron content (TEC) estimate. It has been shown that the GPS satellite biases are fairly stable day-to-day (Sardon et al., 1994 and Wilson et al., 1999), whereas the GPS receiver biases can have significant variation, sometimes over intervals of hours [Coco, 1991]. The Jet Propulsion Laboratory (JPL) delivers estimates of the 10 day average of individual satellite biases to the U.S. Air Force. According to Komjathy (2012), the 10-day average for each satellite differs from the individual day values by 0.1-0.3 nanoseconds (ns). However, to successfully make this 10-day average measurement, the Faraday rotation due to the ionosphere must be removed with an extremely high degree of accuracy. Standard errors for absolute GPS TEC estimation are estimated by the community to be ~3 TECU (1 TECU = 1016 electrons/m2), although the differential GPS TEC measurement is far more accurate (~0.02 TECU). These levels of TEC biases can pose some significant challenges in ionosphericimage reconstruction as reported by Cornely (2003). Most scientists working in the area think we should have absolute TEC values from GPS at the 0.1- 0.2 TECU level, an extremely demanding goal. Slant TEC estimates are obtained from GPS observations using the following equation Dyrud (2008):

It is worth noting that part of the GPS modernization includes a third civilian frequency, L5 = 1176.45 MHz, (Kaplan 2006), which will allow for additional estimates of the TEC using frequency combinations at each time sample. The advantages for the atmospheric science community for GPS modernization are described in Van Dierendonck and Coster (2001). In the early days of GPS, the community was uncertain how to estimate either set of biases. However, it was quickly recognized that the delay introduced by the ionosphere changed. Techniques applying this property to estimate the biases are described in works by Mannucci et al., 1993, and Komjathy, 1997. Work at the NASA JPL (e.g. Lanyi and Roth, 1988) led to initial algorithms for bias estimation. Other methods were developed using single receivers (Coco et al., 1991, Gaposchkin and Coster, 1993). More powerful techniques based on the global network of receivers (Wilson and Mannucci, 1993 and Sardon et al., 1994) then followed. The estimation of satellite and receiver biases remains an area of significant and active investigation within the ionospheric community. New and enhanced techniques have been recently developed that estimate receiver differential biases for all available GPS stations (typically around 1000 sites) on a daily basis (Komjathy et al., 2005 and Rideout and Coster, 2006). The research community needs more efficient and improved estimation algorithms to properly perform process and quality checks on the large amount of GPS data currently available on a daily basis.
This chapter looks at one possible error in the standard practices of determining receiver biases. Specifically, the most common procedure within the community involves applying a single value for the receiver bias, and another one for each individual satellite bias, over a 24-hour time frame. For the satellite biases, most groups rely on those estimated by the international GNSS organization (IGS) or those of IGS contributing members. These values are available on-line at the Crustal Dynamics Data Information System (CDDIS). Receiver biases, on the other hand, are typically estimated by the individual groups processing TEC. Typically, the estimate of the receiver bias is made over a full 24-hour period. This practice averages over any temporal changes in temperature. In the literature, there have been hints of issues with temperature, for example the thermal influence on time and frequency transfer has been studied (Rieck, C., 2003). It is assumed that the temperature dependence in the L1-L2 receiver bias is due to a combination of the following: 1) the hardware in the pre-amplifier of the antenna, 2) to the cable connecting the antenna, and 3) the receiver hardware itself. Receivers that measure the biases due to the receiver hardware have been built (Dyrud et al., 2008), but they neglect to account for the receiver bias due to 1) and 2). In this chapter, our aim is to demonstrate that changes in the estimated receiver bias exist due to changes in temperature, and this will affect the absolute TEC that can be obtained with GPS
Receiver bias estimation
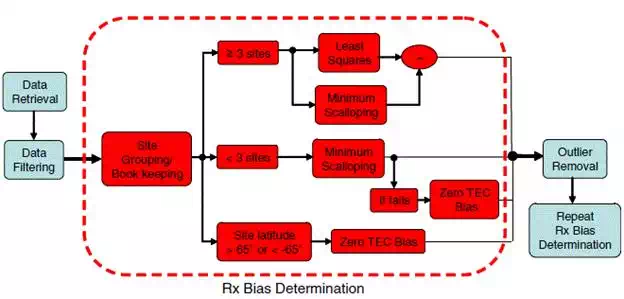
To test our hypothesis of temperature dependence on receiver bias estimation, we estimated daily receiver bias values during the night-time period from 12:00 am to 2:00 am when the ionosphere is expected to be fairly stable. A software package known as MIT Automated Processing of GPS (MAPGPS) has been developed to automate the processing of GPS data into global total electron density (TEC) maps. Observations are used from all available GPS receivers during all geomagnetic conditions where data has been successfully collected. In this section, the architecture of the MAPGPS software is described. Particular attention is given to the algorithms used to estimate the individual receiver biases. The MAPGPS approach to solving the receiver bias problem uses three different methods: minimum scalloping, least squares, and zero-TEC. A top level block diagram illustration of the MAPGPS system is shown in Figure 1.
To estimate receiver biases, MAPGPS uses a procedure which relies on a combination of three different methods. The first method, minimum scalloping, was developed by P. Doherty (private communication) and depends on the assumption that the ‘‘scalloping’’ in the values of zenith TEC estimates from the different satellites observed over a 24 h period should be minimized. The second method, least squares, uses a least squares fitting routine to compute the differential receiver biases. The least squares method in MAPGPS is based on an earlier procedure developed at MIT Lincoln Laboratory (Gaposchkin and Coster 1993; K. Duh, private communication). The least squares method measures only the differential biases, however, and so must be combined with the other methods to determine absolute bias levels. The third method used by MAPGPS is the zero TEC method. In this method, the bias value of the receiver is selected to be that which sets the minimum value of the TEC over a 24-h period to be zero. We describe these methods in more detail in the following paragraphs.
Minimum scalloping method
The minimum scallop technique is based on the principle that zenith TEC values computed from low elevation angle data should not, on average, be different from zenith TEC values computed from high elevation angles. Of course, during some time periods, there may be temporary ionospheric structures that make this assumption false, such as at sunset or sunrise when gradients are frequently present in the TEC. Because of this, this technique has been implemented in a way that tries to average TEC values over a relatively long period. In general, a mapping function converts the line-of sight TEC at lower elevation angles to its vertical or zenith value. However, the part of the TEC observation that is caused by receiver bias, and not the ionosphere, is unaffected by elevation angle. When the mapping function is applied to a receiver using an incorrect receiver bias, the estimated vertical TEC values will be in error. Specifically, the vertical TEC values that correspond to low elevation angles will be either increased or decreased, depending on the sign of the bias. The minimum scallop technique can be applied to the TEC data around local midnight, where there should be less inhomogeneity in the TEC. For a given receiver bias, we bin and median filter the vertical TEC values by elevation angle, and determine the flatness of the resulting median TEC versus elevation-angle. The receiver bias that gives the flattest value of TEC versus elevation angle is the minimum scallop receiver bias. While no systematic errors were found to be associated with this technique, the standard deviation of day-to-day estimations of the same receiver is about 2 TECU. It is not clear whether this 2 TECU value is due to innate problems with the algorithm or with actual receiver bias variability, or some combination of both.
Least squares method
To use the least squares method, a system of equations is set up using a number of observations and unknowns. On any given day, each GPS receiver observes multiple satellites multiple times. Each observation consists of a TEC estimate, a satellite bias, and a receiver bias. The receiver bias is assumed to be constant over the day for each receiver, and the satellite bias is assumed to be constant over the day for each satellite. In this processing, the satellite biases are assumed to be known. The problem of estimating the receiver biases is thus over-determined to a large degree as there are many more observations than unknown receiver biases. Accordingly, the method of least squares is well suited to find the best-fit solution. To compute the differential relationship between the different receiver biases, a system of difference observations is created as follows: An observation, O, is described as (ignoring measurement error):


Zero TEC method
This method is based on the principle that the TEC often approaches zero during the night or at high latitudes. Therefore, the receiver bias in this method is calculated by setting the minimum observed value of the TEC over a 24 h period equal to zero. This method has the advantage that it is simple to use, and in a relative sense it is reasonably robust. Nevertheless, especially in the equatorial regions, one does not anticipate the minimum value of the TEC to be equal to zero. Noise can also affect the estimation. Using this assumption to calculate the biases may cause non-negligible errors.
MAPGPS receiver bias determination
In MAPGPS, the receiver bias determination is an iterative process involving several steps. This process is illustrated inside the dashed line in Figure 10. This Figure shows how the three methods described above are applied either in combination or individually to resolve the receiver bias. The first step in this process is to filter out data with elevation angles of less than 30degrees in order to separate out mapping function effects from the calculation of receiver bias. This is done because scalloping can be caused by both the receiver bias and a faulty mapping function. Above 30 degrees elevation angle, all the mapping functions are very similar, and yet at 30 degrees the slant delay is still almost twice the zenith delay at zenith. This leaves enough elevation angle effect to separate out the receiver bias. Once the data with elevation angles greater than 30 degrees has been collected, groups of sites are created by starting with a randomly selected seed site. Next all remaining available receiver sites are searched to find the receiver site in the closest proximity to any of the group members. If this identified site is within a 400 km horizontal distance, it is added to the group. The 400 km horizontal distance was chosen in order to ensure that within any group there would be a large number of coincident TEC measurements (defined as TEC estimates from different receivers that are separated by not more than 50 km in the horizontal location at the pierce point height of 450 km). This procedure is repeated until either there are no remaining sites within 400 km of any group member, or the group reaches a maximum number of 100 sites. Once this step is complete, the method for determining the differential bias is dependent on the number of sites in the group. If the group consists of three or more sites, the differential biases are found using the least squares method which outputs relative, not absolute, biases. To set the level of the absolute bias, we could simply use the minimum scallop receiver bias for a single receiver. However, the minimum scallop technique has a certain amount of random uncertainty embedded in it. To reduce this uncertainty, we determine the minimum scallop receiver bias for all of the receivers in the group. We then find the average difference between these values and those computed by the least squares technique. In this way, the error in the absolute value of the receiver bias in the group is reduced by a factor of the square root of the number of receivers. Processing data from 1,000 stations takes approximately 12 h to run on a single computer with a Pentium 4 class.
If the group contains fewer than three sites, the differential bias is found using the minimum scalloping technique. First, the zero TEC bias is computed and used as the initial guess. Next for a range of biases about the initial guess, a histogram of average TEC values versus elevation angle bin is constructed for data in a 4 h window centered on 2 a.m. local (solar) time. The slope of this histogram is calculated. If the minimum slope is at the edge of the range of biases, the process is assumed to have failed and the process is repeated with the histogram constructed for data in a 4 h window centered on solar noon. If the process fails a second time, it is repeated again with larger bias limits. In general, this process succeeds approximately 95% of the time. The zero TEC method is employed in two cases. This method is used in the 5% of the cases where the minimum scalloping technique fails and it is automatically used for receivers located at latitudes above 65 degrees latitude. The reason for this latitude criterion is the typical high latitude variability of the TEC. These values are expected to be larger in magnitude than the scalloping effect. Because of this, the minimum scalloping technique fails to work for high latitude data.
Description of experiments
In the experiments, four Scintillation Network Decision Aid (SCINDA) GPS receivers were used at two different sites. The SCINDA is a network of ground-based receivers that monitor scintillations at the UHF and L-Band frequencies caused by electron density irregularities in the equatorial ionosphere (Groves et al., 1997). The four SCINDA receivers are all NovAtel dual frequency GISTM receivers running the specialized software described in Carrano and Groves (2006). The temperature data were collected with EasyLog USB data loggers, which collect temperature, dew point and humidity data. Temperature data were verified by comparing the measurements to the National Oceanic and Atmospheric Administration’s measurements at the site of one of the first site. These temperature loggers have a stated manufacturers accuracy of ±0.5°C(±1°F), and a repeatability of ±0.1°C (±0.2°F) over the range -35°C to 80°C (-31°F to 176°F). In the sampling, the temperature is measured to the 0.5°C level. For the experiment at the first site, data were collected for over a hundred days using two temperature sensors (one indoors and the other outdoors) and a single GPS receiver. In this experiment, the goal was to determine and remove the temperature dependence of the receiver bias. A second experiment was conducted at the other site which involved a comparison of TEC estimates from three collocated GPS receivers over a single 24-hour period. The primary goal of this experiment was to observe if the temperature dependence of receiver bias estimation varies from receiver to receiver.
We will first describe experiments at the first site where data was collected from day 15 to 150, 2010. This data set is used to attempt to model and remove the temperature dependence on receiver bias estimation. The remaining residual bias is examined for dependence on other parameters that may need to be considered in future modeling efforts.
Experiment at the first site
In a first experiment, temperature data were collected with two temperature loggers that were collocated with the single GPS SCINDA receiver that ran continuously at the first site. One of these temperature loggers was located inside the building near the receiver and the other was located outside the building on the pole of the antenna. It is important to note that the antenna was located on a black top roof, where temperatures are expected to exceed the local ambient temperature.
Results
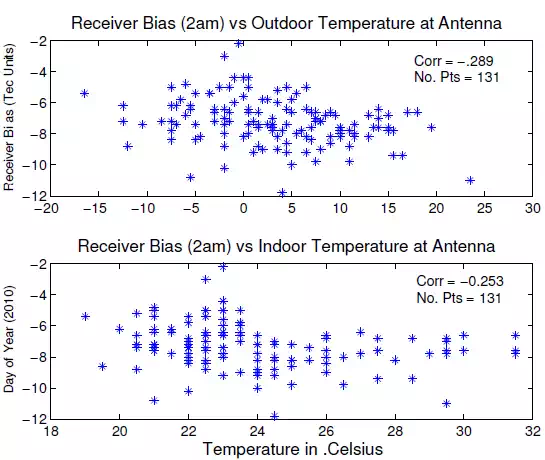
For each day, an average temperature for the night-time period from 12:00 am to 2:00 am was computed. Figure2 shows the outdoor and indoor temperature data plotted as a function of the corresponding bias value from day 15 to 150 2010 (January 2010 to June 2010).
It is important to note that the temperatures and bias values shown in this plot and used in this chapter are from the 12:00 am to 2:00 am local time period. The Pearson correlation coefficient (r), which represents the linear relationship between two variables, is determined for both the outdoor temperature versus bias (top plot) and the indoor temperature versus bias (bottom plot). Other fits to the data (such as fitting to a quadratic) were no more significant, as such the linear model was used exclusively. For a statistical sample size greater than 100, as is the case in the data being used with 131 points, an r value greater that.254 or less than -.254 is rated significant. Because the Pearson correlation coefficient r, is equal to -.289 for the outdoor temperature versus bias value versus -.253 for the indoor temperature versus bias, we decided to first remove the correlation observed between the receiver bias and the outdoor temperature. In addition, as shown in Figure 2, there is an apparent break in the indoor temperature data versus receiver bias (this can be observed visually at approximately 24°C).
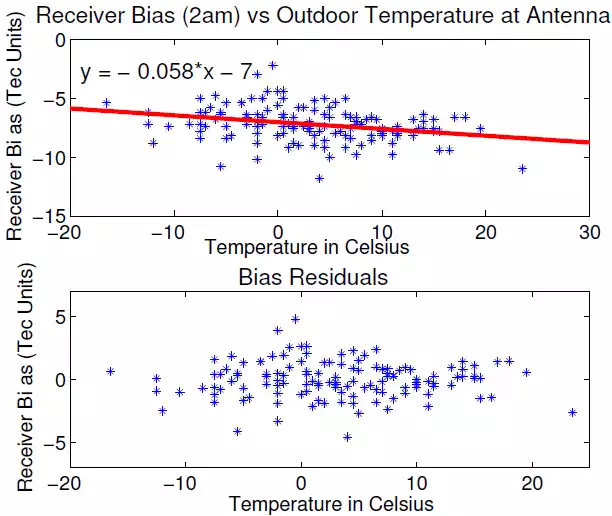
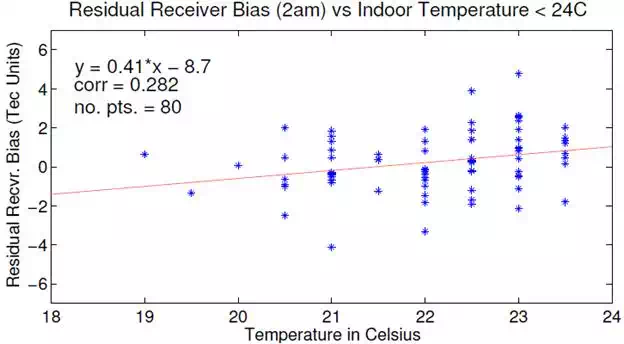
To remove this correlation, a linear trend was computed for the outdoor temperature versus receiver bias (shown in the top plot of Figure 2) and removed from the data. The residuals are shown in the bottom plot of Figure 2. Figure 3 shows the resulting receiver bias residuals versus the indoor temperature. In this plot, a clear break can still be observed in the data at 24°C. It is assumed that data below 24°C is indicative of time periods where the heater in the optics building was having difficulty maintaining a constant temperature. This may account for the larger fluctuations below 24°C. For this data set, the data were divided into two groups corresponding to the residuals associated with the data less than and greater than or equal to 24 °C.
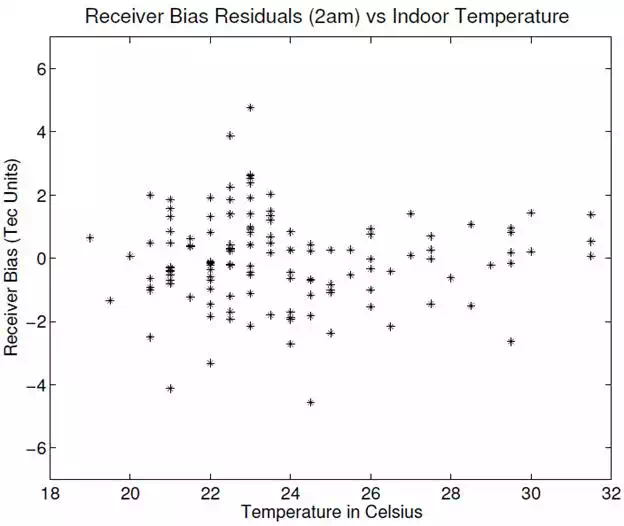
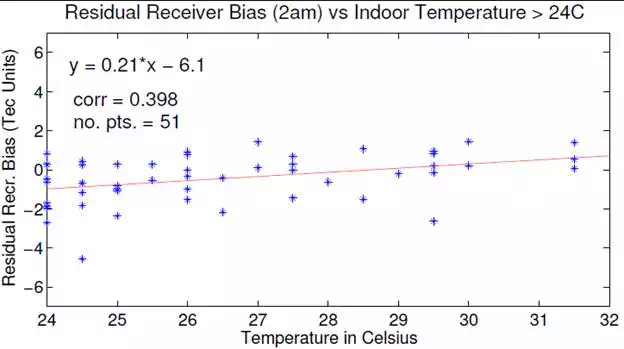
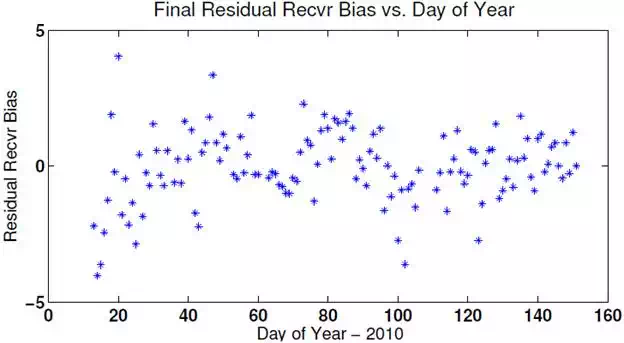
Linear fits were computed for each of these groups. These fits and the corresponding Pearson r values are shown in Figures 4 and 5. For the data corresponding to temperatures greater than 24 °C, the Pearson r value is fairly high (r = 0.398). Once these linear trends have been estimated and removed from the data, the final residuals are shown in Figure 6. Clearly a 2-3 TEC fluctuation level remains in the biases versus day of year plot. To test if additional factors should be accounted for in our bias estimation techniques, several atmospheric parameters were examined to see if any additional correlations could be found. The atmospheric parameters selected to study for correlations included the Ap, Kp, and the daily and 90-day averaged F10.7 cm solar flux. These parameters are important in measuring solar activity (daily and 90-day averaged F10.7 cm solar flux) and the Earth’s magnetic and electric field disturbances (the Kp and Ap).
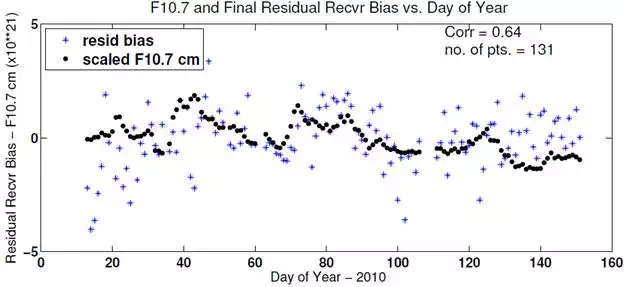
The only parameter that strongly stood out as highly correlated with our residuals was the daily f10.7 cm solar flux, which is a measurement of solar radio emissions at 2800 MHz. This correlation can be observed in Figure 7 where a scaled daily F10.7 cm value is over plotted onto the final residual receiver bias. The correlation factor between these two data sets is 0.64. The observed correlation is suspected to be related to the mapping function used in the receiver bias estimation. This mapping function is described in Rideout and Coster, 2006 and depends only on the elevation, and has no built-in term for the ionospheric shell-height. This approach was based on the assumption that there is little variability in the ionospheric shell-height in the two hour window after midnight when all the receiver biases are estimated. Nevertheless, it is important to point out that the ionospheric shell-height does have some day-to-day variability that is not captured in the model being used, and this additional error source could perhaps account for some of the un-modeled errors observed. Some of this error can also be attributed to remaining errors in the satellite biases.
Experiment at the second site
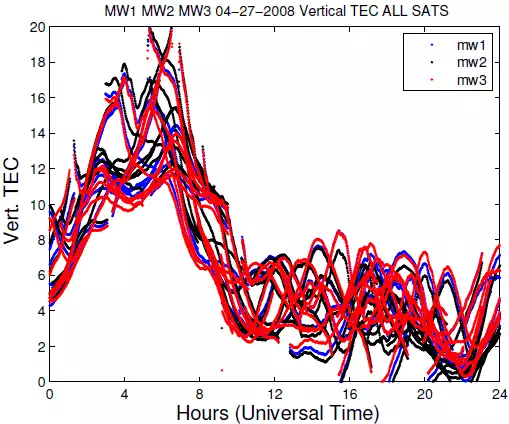
On April 25, 2008, three Scintillation Network Decision Aid (SCINDA) GPS receivers were located at the MWA site, separated by approximately 10-20 m. Figure 8 shows the total vertical TEC estimated by each receiver over the full 24 hour period. The vertical TEC plot is shown here to illustrate the diurnal pattern of the TEC., and indeed a clear diurnal pattern can be observed, with the maximum TEC reaching 18-20 TEC units at around 4-5 UT and the minimum TEC reaching 0-2 TEC units around 16-17 UT. Receiver bias and satellite biases have been applied to the data. The different colors (red, black, and blue) represent the TEC estimates of the different receivers. Only where the estimates of vertical TEC differ is it possible to see the different colors.
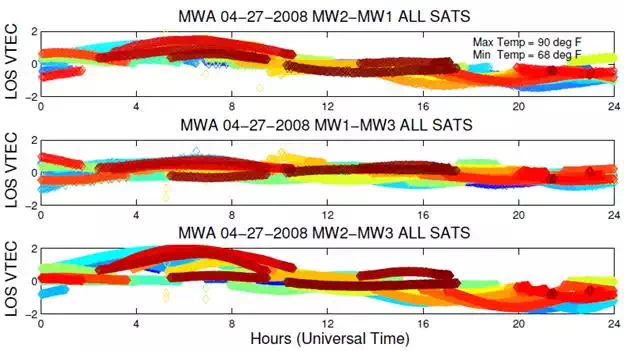
Shown in Figure 9 are the line-of-sight (los) differential TEC measurements between these different receivers as a function of time of day. The top plot shows the differential los TEC measurements between receivers MW2 and MW1, the middle plot shows the differential los TEC between receivers MW1 and MW3, and the bottom plot show the differential los TEC between MW2 and MW3. The different colors in each plot represent the different GPS satellites. As all of receivers were within 10-20 m of each other, the differential los TEC values should be either constant as a function of time of day, or at the very least, relatively constant. What is observed, however, are larger values in the differential TEC during the daytime and smaller values during the night. This diurnal structure is largest in the bottom plot which shows the differential los TEC values between MW2 and MW3 and smallest in the middle plot which shows differential los TEC between MW1 and MW3. One would surmise from this that receiver MW2 has a receiver bias temperature dependence that differs significantly from that of MW1 and MW3. While the exact temperature excursion between day and night on April 27, 2008 is not known for the site, it is known from historical records that the low local temperature for April 27, 2008 was 68F, and the high temperature was 90F. Based on the observations in Figure 9, we are suggesting that the observed changes in the differential TEC are due to a receiver bias temperature dependence that differs between the receivers MW1, MW2, and MW3. In other words, the temperature dependence for each receiver is unique and thus requires that the receiver bias be estimated for each individual receiver.
Summary
There are four main conclusions from the above discussion.
1. A clear temperature dependence on the GPS receiver bias is evident
2. This temperature dependence appears to include both indoor and outdoor temperatures
3. Other factors that are not now accounted for, such as the daily F10.7 cm flux, appear to be important in receiver bias estimation.
4. GPS receiver biases appear to be dependent on the individual receiver, and each receiver must be treated independently
With respect to how accurately the absolute total electron content can be determined using GPS for use in the low frequency array calibration it is possible that a 2-3 TEC scatter still remains in the bias estimation process even after the temperature effect is removed (see Figure 7). This number does not represent the relative TEC accuracy which is based on the differential phase measurements of TEC. The relative TEC can be estimated on the order of 0.01 TEC units. The 2-3 TEC scatter remaining in the observed bias estimation is likely due to the inaccuracies of the model used for the ionospheric mapping function. As was mentioned earlier, the mapping function being used does not account for any changes in the ionospheric scale height. The error in the mapping function also lacks a valid plasmaspheric model. Recently Carrano et al., 2009 developed a Kalman filter model to estimate plasmaspheric total electron content. If a better understanding of how to model the temperature effect of the bias estimation can be obtained, it is possible that an extended version of the Kalman filter for bias determination will lead to more accurate estimates of the bias. Clearly more experimental and modeling studies are warranted.
All experiments and partial results in this chapter were obtained from works by the following investigators:
A. Coster1, J. Williams2, A. Weatherwax2, W. Rideout1, D. Herne3, their contributions to this work is highly appreciated
1MIT Haystack Observatory
2Department of Physics, Siena College
3Curtin Institute for Radio Astronomy, International Centre for Radio Astronomy Research
